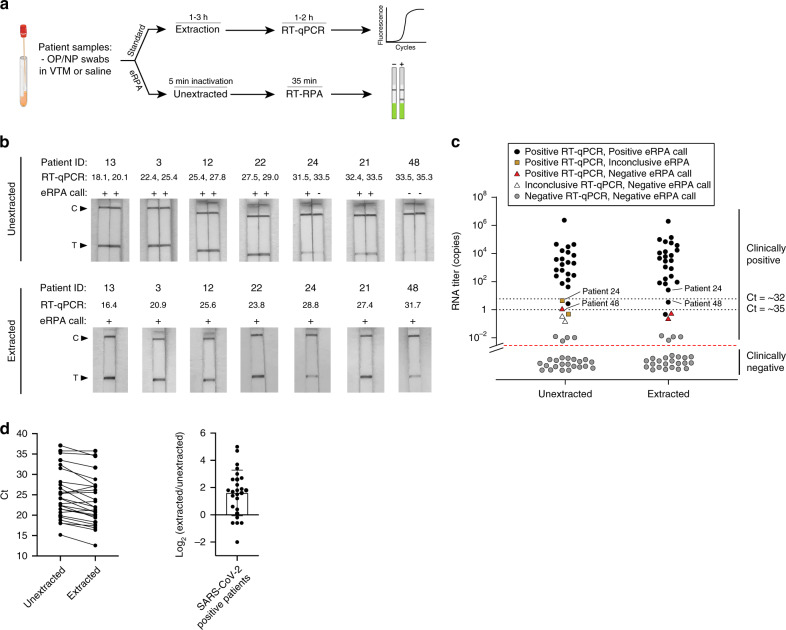
Fig. 4. Detection of SARS-CoV-2 in clinical samples using eRPA.
a Schematic of the workflow for benchmarking eRPA against RT-qPCR using patient samples. b Sampling of lateral flow strip readouts of SARS-CoV-2 N gene eRPA tests of unextracted (top) or extracted (bottom) patient samples (n = 7 biologically independent samples) of known infection status. Unextracted patient samples were run in duplicates both by eRPA (calls of positive (+) or negative (−) were made within 20 min of detection) and by one-step RT-qPCR (Ct values shown). See additional data in Supplementary Fig. 4a. RNA was extracted from clinical samples according to standard procedure (see “Methods” section) and was subsequently used as input to eRPA and RT-qPCR. See additional data in Supplementary Fig. 4b. c Summary of eRPA test results of patient samples (n = 51 biologically independent samples) and comparison to RT-qPCR. The y axis represents patient viral titer determined using a commercial one-step RT-qPCR assay from unextracted samples or extracted RNA samples with a standard curve. d (Left) Matched RT-qPCR Ct values of unextracted and extracted patient samples (n = 26 biologically independent samples) (Right) Difference between extracted and unextracted Ct values for all patients (n = 26 biologically independent samples) with mean value of 1.6 fold +/− 1.7 SD. Source data are available in the Source Data file.

