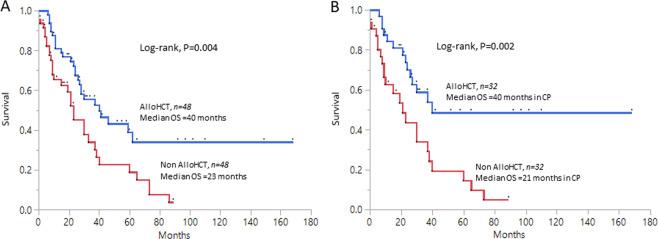
Fig. 1. Figure showing Kaplan–Meier derived overall survival curves among propensity score matched chronic myelomonocytic leukemia (CMML) cohorts.
a Overall survival in a 1:1 propensity score matched cohort for age and Mayo Prognostic Model in allogeneic hematopoietic stem cell transplant (alloHCT) and non-alloHCT groups [inclusive of patients in chronic phase (CP) and blast transformation (BT)]. b Overall survival in a 1:1 propensity score matched cohort for age and Mayo Prognostic Model in alloHCT and non-alloHCT groups in CP only.

