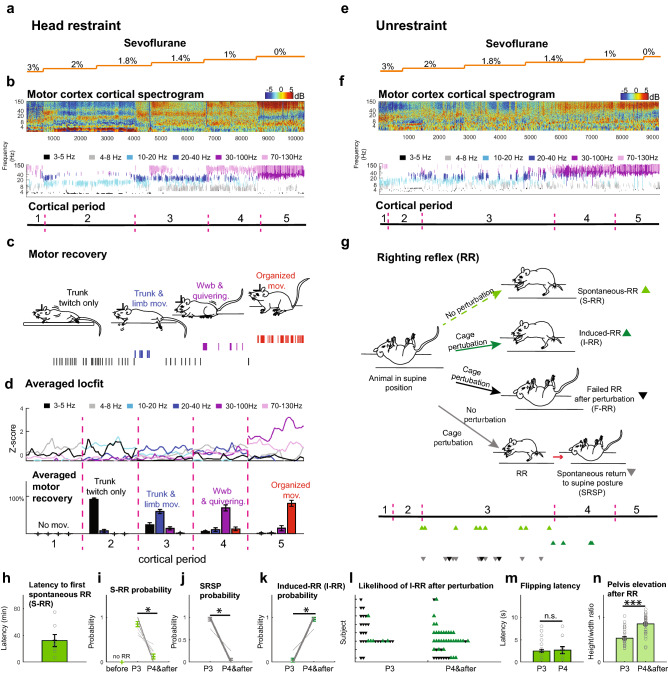
Figure 2 .
Cortico-motor features during emergence from anesthesia indicate RR is an ambiguous metric of arousal. (a) Sevoflurane concentration was ramped down (3% 1MAC to 0%) (b) Top: Normalized spectrogram (deviation from median) of raw LFP recorded in motor cortex (color bar shows power, dBs). Middle: changes in cortical state: black (3–5 Hz), gray (4–8 Hz), light blue (10–20 Hz), dark blue (20–40 Hz), purple (30–100 Hz) and lilac (70–130 Hz) after frequency clustering. Bottom: Cortical segmentation used a density estimation function and abrupt change detection algorithm (periods 1–5). (c) Movements during emergence from anesthesia include trunk-twitching (black lines), trunk/ hindlimb movements (blue lines), weak weight-bearing (Wwb) posture and quivering (purple lines), and organized movements (jumping, grooming etc., red lines). (d) Top: Averaged density estimation per cortical period (n = 13 animals; 500 s interval per period). Cortical periods(dominant frequencies; analysis outlined in methods). Bottom: Percentage of trunk twitching (91% ± 3.6%), trunk and limb movement (59% ± 5.4%), Weak weight-bearing (Wwb; 68% ± 7.8%), and organized movements (81% ± 7.9%). (e) Example raw LFP trace recorded in motor cortex during sevoflurane ramp down (orange line) in unrestrained mice. (f) Normalized spectrogram of cortical period clustering dominant frequencies (k-means /smoothed-Z score algorithm). Bottom: period segmentation obtained as in panel b (periods 1–5). (g) Top: RR events, including spontaneous RR (S-RR; light green triangle), induced RR (I-RR; dark green triangle), failed RR after perturbation (black triangle) and spontaneous return to a supine posture (SRSP; grey triangle). Bottom: Timepoints of RR event occurrence in example animal. (h) Latency from period 3 onset (P3) to first S-RR (n = 7 animals). (i) S-RR probability (n = 8 animals; p = 0.014; Paired Sample Wilcoxon Signed Ranks Test used in panels i-k). (j) probability of SRSP (n = 9 animals; p = 0.008) (k) I-RR probability during different cortical periods (n = 6 animals; p = 0.026). (l) Scatter plot showing the likelihood RR after perturbation. Triangle represent attempts to induce RR from P3 onward. (n = 8 animals). (m) Time from movement onset to supine to prone flip landing on four limbs (n = 39 vs n = 19; p = 0.88 and p = 0.03; Two-Sample Kolmogorov–Smirnov Test). (n) Quantification of pelvis elevation as a proxy for erect posture. (P3 n = 31 and P4&after n = 43; p = < 0.001; Mann–Whitney U test). *p = 0.05, **p = 0.01, ***p = 0.001.

