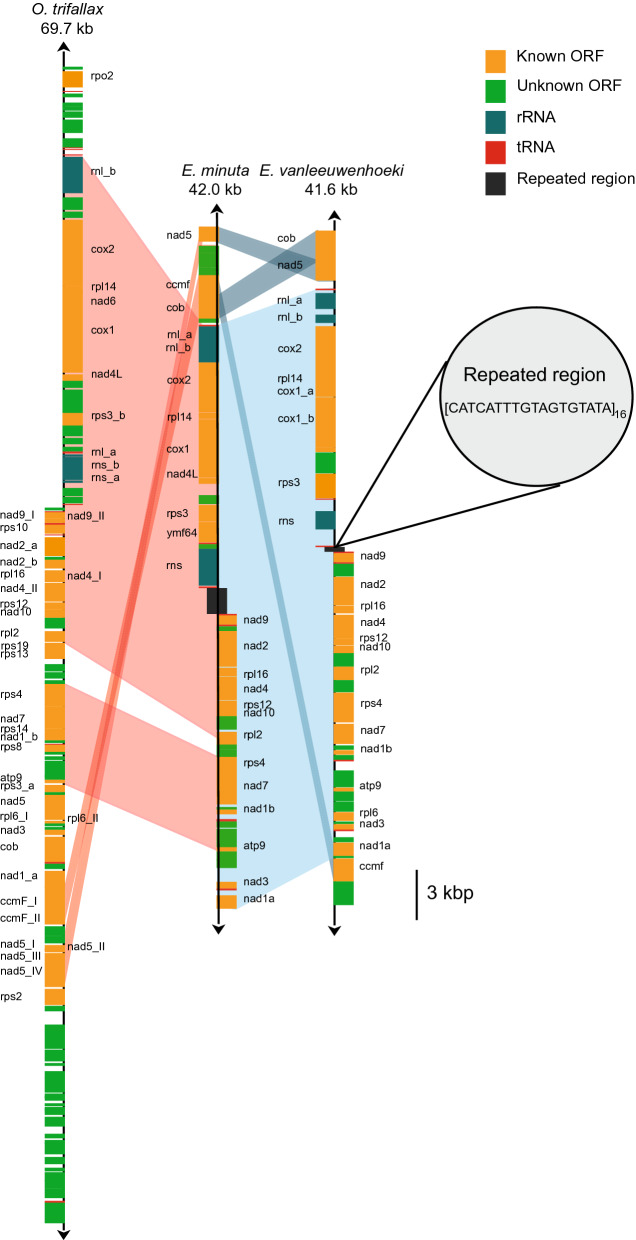
Figure 4.
Mitochondrial gene map of Euplotes vanleeuwenhoeki sp. nov. The gene map of the mitochondrial genome of E. vanleeuwenhoeki in comparison with those belonging to Euplotes minuta and Oxytricha trifallax is represented. Homologous regions among the three genomes are indicated by pale coloured areas. Names of split genes are suffixed by a letter or a lowercase Roman numeral. The direction of transcription is indicated by an arrow at each end of the mitochondrial map.

