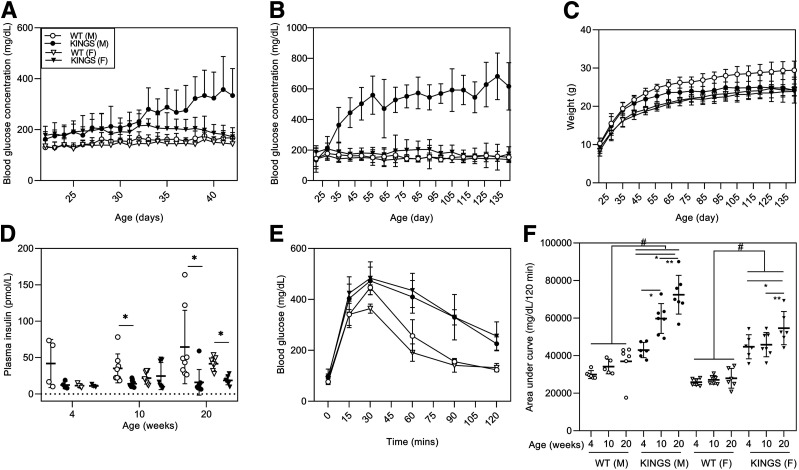
Figure 2.
A and B: Random daily blood glucose concentrations from 22 to 42 days (A) and weekly blood glucose concentrations from 21 to 140 days (B) of wild-type (WT) male, KINGS male, WT female, and KINGS female mice. KINGS male and KINGS female mice show significantly elevated blood glucose compared with sex-matched WT littermates (P < 0.001, two-way repeated-measures ANOVA, Holm-Sidak post hoc, n = 11–15). In male KINGS mice, blood glucose concentrations are elevated by 5 weeks compared with their starting levels measured at 3 weeks (P < 0.001, two-way repeated-measures ANOVA, Holm-Sidak post hoc, n = 13). In all other groups, blood glucose remained constant across the 20 weeks. C: Weekly weight monitoring from 21 to 140 days. Male KINGS mice show lack of weight gain and are significantly different from WT mice by 126 days (P < 0.05, two-way RM ANOVA, Holm-Sidak post hoc, n = 11–15). D: Plasma insulin concentration in male and female WT and KINGS mice at 4, 10, and 20 weeks. Plasma insulin levels were significantly reduced in the KINGS males from 10 weeks and at 20 weeks in the KINGS females compared with WT littermates (P < 0.05, unpaired t test, n = 4–10). E: Glucose tolerance test at 4 weeks of age for WT and KINGS male and female mice. F: Area under the curve for glucose tolerance tests at 4, 10, and 20 weeks. Both male and female KINGS mice show significant glucose intolerance at all time points compared with sex-matched WT mice. Male glucose intolerance worsens with age, and females only show worsening at 20 weeks. #P < 0.05 KINGS vs. age and sex-matched WT mice; *P < 0.05 vs. 4 weeks of age and genotype-matched mice; **P < 0.05 vs. 10 weeks of age and genotype-matched mice; two-way ANOVA, Holm-Sidak post hoc test, n = 5–7.

