

Abstract
Background:
Low-socioeconomic, urban, minority patients with heart failure (HF) often have unique barriers to care. Community health workers (CHWs) are specially trained laypeople who serve as liaisons between underserved communities and the health system. It is not known whether CHWs improve outcomes in low-socioeconomic, urban, minority patients with HF.
Hypothesis:
CHWs reduce rehospitalizations, emergency department (ED) visits, and healthcare costs for low-socioeconomic urban patients with HF.
Methods:
Patients admitted with acute decompensated HF were assigned to receive weekly visits by CHW after discharge. Patients were propensity score matched with controls who received usual care. HF-related rehospitalizations, ED visits, and inpatient costs were compared for 12 months following index admission versus the same period before.
Results:
Twenty-eight patients who received weekly visits from a CHW for 12 months after discharge were matched with 28 control patients who did not receive CHWs. Patients who received a CHW had a 75% decrease in HF-related ED visits (0.71 vs. 0.18 visits per patient, P < 0.001), an 89% decrease in HF-related readmissions (0.64 vs. 0.07 admissions per patient, P < 0.005), and a significant decrease in inpatient cost for HF-related visits. In controls receiving usual care, there was no significant change in hospitalizations, ED visits, or costs.
Conclusions:
In conclusion, CHWs are associated with reduced rehospitalizations, ED visits, and inpatient costs in low-socioeconomic, urban, minority patients with HF. CHWs may be a cost-effective method to reduce health care utilization and improve outcomes for this population.
Keywords: community health worker, health care utilization, heart failure
Heart failure (HF) affects more than 6 million people in the United States and accounts for nearly 1 million hospitalizations each year.1 Health care costs for HF encompass $30 billion each year, with incidence of HF expected to rise 50% by 2030 and health system costs expected to nearly double. Significant improvements in pharmacologic treatment of HF in the last 30 years have led to decreased mortality and HF hospitalization.2 However, improvements have been uneven with lower rates of improvement for underserved populations, especially African Americans.2 Despite these evidence-based treatments to improve HF outcomes, low-socioeconomic urban patients still face many barriers to appropriate chronic disease management including limited access to care, nonadherence to prescribed treatments, and lack of support for self-management.3
Community health workers (CHWs) are specially trained laypeople who serve as liaisons between underserved communities and the health system.4 They aim to increase access to health care services and make these services more effective by reducing barriers to chronic disease management. CHWs have been used in the management of chronic diseases in the United States, mostly in hypertension, diabetes, and asthma care.3 Through the use of CHWs, various studies have shown a decrease in health care utilization,5-7 reduction in health system costs,8,9 and most importantly improvement in clinical outcomes.10,11 This evidence has led the Institutes of Medicine and the Centers for Disease Control to recommend utilization of CHWs for underserved and high-risk communities to improve health care delivery.12
However, the effect of CHWs in the management of patients with HF is unclear. One study used semistructured interviews of community health advisors and found that many African American patients lack appropriate social support needed to manage chronic disease. That study concluded that providing increased social support through CHWs may help management of HF.13 Others have found that adding CHWs to care teams improved outcomes for rural HF patients.14,15 However, no study of which we are aware has examined the impact of CHWs on low-socioeconomic, urban, minority patients with HF, a notoriously difficult group to manage whose healthcare barriers differ from those of rural patients. In April 2016, our center implemented a new CHW program for patients with HF as a quality improvement initiative. These CHWs provided assessments and support both in the patients’ homes and on the telephone and relayed critical information back to the clinical care team. This study examines the outcomes of patients enrolled in that program compared with similar historical controls who received usual care. We hypothesized that patients who received home visits and telephone follow-up from a CHW would have reduced healthcare utilization in the hospital and the emergency department (ED) and decreased healthcare costs.
METHODS
Study Population
This retrospective cohort study examined patients admitted to The University of Chicago Medical Center with acute decompensated HF between April 2016 and May 2017. Patients were identified who lived within 1 of 12 low-socioeconomic zip codes on the South Side of Chicago within our center’s community benefit service area, had “in network” insurance, were not homeless or incarcerated, received their outpatient cardiovascular care at our center for at least 1 year, and were not being evaluated for a left ventricular assist device, orthotopic heart transplant, or hospice. These patients were invited to receive home visits and telephone calls by a CHW after discharge. If the patient agreed, a multidisciplinary team consisting of a CHW, a specially trained nurse, a nurse practitioner, a social worker, and a cardiologist, then reviewed each patient’s chart to define specific needs that could be addressed by the CHW. Enrolled patients were compared with a nearest neighbor propensity matched cohort16 with a principal diagnosis of acute decompensated HF and who met the same inclusion criteria above. These patients were matched using 30 clinical and demographic variables, including surrogates for healthcare literacy, such as prior healthcare utilization and median household income (Table 1). All patients, including historical controls, received standardized education during hospitalization, close follow-up upon discharge, and early cardiology consultation for future ED visits as part of a prior quality improvement initiative.16
TABLE 1.
Baseline Demographics and Characteristics
| Characteristic | Control | Community Health Worker | P |
|---|---|---|---|
| Number | 28 | 28 | |
| Age, years [IQR] | 63.50 [52.75–74.00] | 64.50 [57.00–77.25] | 0.512 |
| Female sex (%) | 16 (57.1) | 17 (60.7) | 1 |
| Black race (%) | 28 (100.0) | 28 (100.0) | 1 |
| Not Hispanic/Latino (%) | 28 (100.0) | 28 (100.0) | 1 |
| Median household income, $ [IQR] | $29,557.50 [26,228.50–37,254.00] | $32,024.00 [27,091.00–10,587.00] | 0.434 |
| NYHA class (%) | 0.788 | ||
| 2 | 13 (46.4) | 12 (42.9) | |
| 3 | 15 (53.6) | 16 (57.1) | |
| Heart failure type (%) | 0.792 | ||
| HFrEF: ischemic | 6 (21.4) | 8 (28.6) | |
| HFrEF: nonischemic | 12 (42.9) | 10 (35.7) | |
| HFpEF | 10 (35.7) | 10 (35.7) | |
| HOSPITAL Scorc (%) | 0.893 | ||
| Low risk (≤4) | 20 (71.4) | 19 (67.9) | |
| Intermediate risk (5–6) | 6 (21.4) | 6 (21.4) | |
| High risk (≥7) | 2 (7.1) | 3 (10.7) | |
| LVEF, % [IQR] | 39.70 [29.75–52.75] | 36.50 [30.75–56.25] | 0.762 |
| BMI [IQR] | 34.32 [28.99–37.22] | 30.30 [23.36–14.73] | 0.441 |
| Heart rate, beats per minute [IQR] | 74.00 [68.50–84.25] | 75.00 [62.75–84.25] | 0.64 |
| SBP, mm Hg [IQR] | 131.50 [113.50–144.50] | 126.00 [114.25–134.50] | 0.412 |
| DBP, mm Hg [IQR] | 73.50 [65.75–81.00] | 70.00 [61.50–74.25] | 0.456 |
| Creatinine, mg/dL [IQR] | 1.70 [1.08–2.23] | 1.70 [1.17–2.35] | 0.818 |
| Hematocrit, % [IQR] | 33.15 [26.10–35.42] | 33.40 [27.52–36.70] | 0.486 |
| N-terminal pro-BNP, pg/mL [IQR] | 4202.50 [2020.00–10,619.25] | 4744.00 [1734.25–11,097.50] | 0.831 |
| Platelets, 103/μL [IQR] | 239.50 [199.75–326.50] | 212.50 [194.25–290.25] | 0.21 |
| Hemoglobin, g/dL [IQR] | 10.30 [8.30–11.40] | 10.60 [8.55–11.80] | 0.461 |
| COPD (%) | 7 (25.0) | 11 (39.3) | 0.391 |
| Diabetes (%) | 17 (60.7) | 19 (67.9) | 0.78 |
| Hypertension (%) | 27 (96.4) | 28 (100.0) | 1 |
| Dyslipidemia (%) | 10 (35.7) | 12 (42.9) | 0.784 |
| Coronary artery disease (%) | 12 (42.9) | 16 (57.1) | 0.423 |
| Atrial fibrillation (%) | 5 (17.9) | 9 (32.1) | 0.355 |
| Aldosterone antagonist (%) | 11 (39.3) | 12 (42.9) | 1 |
| Beta blockers (%) | 24 (85.7) | 23 (82.1) | 1 |
| ACE-I/ARB (%) | 19 (67.9) | 18 (64.3) | 1 |
| Loop diuretic (%) | 24 (85.7) | 25 (89.3) | 1 |
| Statin (%) | 20 (71.4) | 23 (82.1) | 0.527 |
| Antiplatelets (%) | 22 (78.6) | 23 (82.1) | 1 |
| Anticoagulants (%) | 24 (85.7) | 27 (96.4) | 0.349 |
The HOSPITAL Score is an internationally validated risk tool for predicting hospital readmissions. Developed by Donze and colleagues, the score consists of 8 factors which spell “HOSPITAL” acronymically: Hemoglobin, discharge from an Oncology service, Sodium level at discharge, any coded Procedure during the hospital stay, Index admission Type, number of previous Admissions in the prior year, and Length of stay.21,22
ACE-I indicates angiotensin-converting enzyme inhibitor; ARB, angiotensin receptor blocker; BMI, body mass index; BNP, brain natriuretic peptide; COPD, chronic obstructive pulmonary disease; DBP, diastolic blood pressure; HRpEF, heart failure with preserved ejection fraction; HRrEF, heart failure with reduced ejection fraction; IQR, interquartile range; LVEF, left ventricular ejection fraction; SBP, systolic blood pressure.
Study Intervention
CHWs received 30 hours of core skills training including those prioritized by the Illinois CHW Advisory Board.17 This included health systems navigation, social support, motivational interviewing, and stages of change. This was followed by approximately 1 month of on-the-job training including disease-specific training on HF management (facilitated by a nurse practitioner), mock home visits and role plays, and shadowing seasoned CHWs. Feedback was provided by a program manager to ensure that protocols were closely followed.
Within 3 days of discharge, CHWs conducted an initial home visit with a standard assessment (Figure S1, Supplemental Digital Content, http://links.lww.com/HPC/A215) including vital signs and questions regarding well-being, weight management, symptoms, and medication adherence. CHWs ensured that medication trays were filled appropriately and in accordance with discharge instructions. CHWs screened for substance abuse, reinforced upcoming clinic appointments, monitored for outside health care utilization, and assisted patients with food access. During the initial session, education was conducted on how to monitor weight, eat less salt, and take medications. Subsequent visits also involved food labeling by walking through each patient’s kitchen, teaching about healthy foods, and labeling salty foods. CHWs provided patients with medication trays and a scale if these items were not present in the home. CHWs also made referrals to community resources during each visit as necessary.
Each patient’s responses were discussed with the multidisciplinary team each week, and concerning clinical issues were addressed by the nurse, nurse practitioner, or cardiologist on an individualized basis. Certain very concerning responses as indicated on the standard questionnaire triggered immediate action with either clinic follow-up or ED referral.
CHWs conducted 2 home visits in the first week after discharge followed by weekly home visits for the subsequent 3 months, alternating between visits and telephone calls. Frequency of home visits was spaced to monthly between months 4 and 12. The CHW visit timeline is summarized in Figure 1.
FIGURE 1.
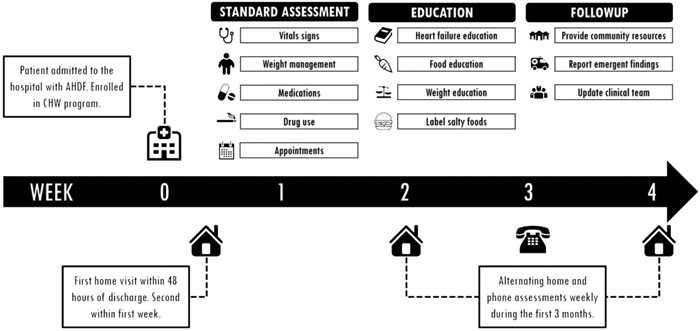
CHW visit timeline and workflow. Community health workers conducted an initial home visit within 3 days of discharge and an additional visit within the first week. CHWs conducted a standard assessment including vital signs and questions regarding well-being, weight management, symptoms, and medication adherence. Education was conducted on how to monitor weight, eat less salt, and take medications, and follow-up was established. CHWs conducted weekly visits for the subsequent 3 months, alternating between home visits and telephone calls. Frequency of home visits was spaced to monthly between months 4 and 12.
Cost Analysis
Financial data were obtained that included detailed direct and indirect costs for both inpatient admissions and ED visits at our center. Direct costs were expenses in cost centers that provide patient care. Indirect costs, or overhead, were expenses in cost centers that did not provide patient care. Inpatient costs reported in this study are the sum of both direct and indirect costs. Costs were calculated based on time-driven activity-based costing18 to best estimate the actual costs to the hospital system. For example, for a complete blood count, the total cost would be the sum of an estimate of direct materials (such as reagents and laboratory tubes), overhead costs (such as laboratory facility fees, manager salaries), and laboratory technician labor (from time-driven activity-based costing of the amount of time a technician spends on each test). Costs for both the treatment and control cohorts were calculated identically. Inpatients cost is reported for only HF-related visits as defined below.
Statistical Methods
Healthcare utilization was compared between the control and treatment cohorts. HF admission was defined as those with a principal diagnosis of HF (ICD 9 code 428.XX; ICD 10 code I50.XX). Number of HF-related and all-cause readmissions and ED visits at our center were calculated at 3-, 6-, and 12-month intervals before and following index admissions. For intervention patients, index admission was defined as the hospital admission date during which a patient was enrolled to receive the CHW. For control patients, index admission was defined as the admission where the control patient was matched to an intervention patient.
Within-cohort rates for HF-related admissions, all-cause admissions, and ED visits before and following index admissions were compared using a paired Wilcoxon ranked-sum test. Between-cohort rates were compared using an unpaired Wilcoxon ranked-sum test. Student t tests were used to determine statistical significance of differences between continuous variables, and χ2 tests were used for categorical variables.
Composite endpoints of mortality and rehospitalization were used for survival analysis. Survival outcomes 365 days postdischarge between the intervention and control groups were assessed using Kaplan-Meier survival distribution. All data are reported as mean ± SD unless otherwise indicated. A P value of <0.05 was considered statistically significant. Data were analyzed using R version 3.4.2.
We estimated the necessary sample size by assuming a 12-month probability of HF-related admission of 0.64, consistent with our historical data. We further assumed a hazard ratio of 0.39 which is consistent with other high-touch interventions to reduce HF-related readmissions at our center.16,19 With a power of 0.8 and type I error rate of 5%, a total of 56 patients were needed for this study, divided equally between the Intervention and Control groups.
Although the CHW intervention was designed as a quality improvement initiative, the protocol for retrospective data gathering and analysis was approved by the Institutional Review Board at the University of Chicago under a general waiver of consent. Study data were collected and managed using REDCap electronic data capture tools20 hosted at The University of Chicago.
RESULTS
Patient Characteristics
Twenty-eight patients were enrolled to receive weekly home visits by a CHW (see Fig. 2 for patient flowchart). These patients were matched using propensity score matching as described above with 28 patients who received usual care including standardized education during hospitalization, close follow-up upon discharge, and early cardiology consultation for future ED visits.16
FIGURE 2.
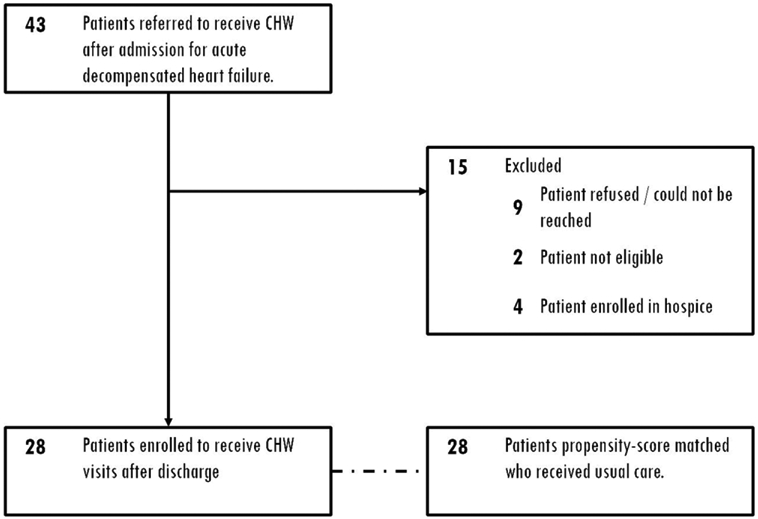
Patient enrollment flowchart. Forty-three patients were referred to receive a CHW after and admission for ADHF. Fifteen were excluded as shown. Twenty-eight patients were enrolled in and completed the program. ADHF indicates acute decompensated HF.
There were no statistical differences between control and CHW patients in regards to patient demographics, prior health care utilization, comorbid conditions, vital signs on discharge, laboratory findings on discharge, or medications on discharge (Table 1). Patients in the control group had similar age (63.50 vs. 64.50 years, P = 0.51), gender (57% female vs. 61% female, P = 1.00), race (100% African American for both groups), and median household income ($29,557 vs. $32,024, P = 0.43) as the CHW group. In the 12 months before admission, both control and CHW group patients had an average of 0.71 ED visits and 0.64 hospitalizations per patient. Readmission risk was measured by the HOSPITAL Score21,22 and was not different between the groups.
All patients in this study were American College of Cardiology/ American Heart Association stage C. Approximately 40% of each group was New York Heart Association (NYHA) class 2 and 60% NYHA class 3. Patients with NYHA class 1 or 4 HF were not enrolled in this study. Sixty-four percent of each group had heart failure with reduced ejection fraction, whereas 36% had heart failure with preserved ejection fraction. Among patients with heart failure with reduced ejection fraction, approximately one third of patients had ischemic cardiomyopathy and two thirds of patients had nonischemic cardiomyopathy. There were no statistical differences between the CHW and Control cohorts for HF type or severity.
Prevalence of common comorbid conditions was also similar in both groups. At the time of discharge from index admission, there was no significant difference in vital signs, including heart rate (74 vs. 75 bpm, P = 0.64), systolic blood pressure (132 vs. 126 mm Hg, P = 0.41), and diastolic blood pressure (74 vs. 70 mm Hg, P = 0.46) between the groups. Laboratory studies including blood counts, serum creatinine, and N-terminal pro-brain natriuretic peptide showed no difference between the groups. Medications at discharge were similar between both groups.
On average, patients in the intervention group received 5.7 CHW encounters over the study time period. These included, on average, 3.5 home visits and 2.2 telephone calls.
Readmissions and ED Visits
In a survival analysis of a composite endpoint of freedom from rehospitalization or death, there was a significant decrease in the CHW group compared with the control group (log rank test, P < 0.05, Fig. 3). In the CHW cohort, there was a significant decrease in HF-related hospital readmissions in the 6 and 12 months after index admission, compared with the 6 and 12 months prior (6 months: 0.39 readmissions per patient before vs. 0.07 after, P < 0.05; 12 months: 0.64 before vs. 0.07 after, P < 0.005). CHW patients also experienced a significant decrease in HF-related ED visits during these time periods (6 months: 0.43 visits per patient before vs. 0.18 after, P < 0.05; 12 months: 0.71 before vs. 0.18 after, P < 0.005). Likewise, patients in the CHW cohort exhibited a significant decrease in all-cause ED visits in the 12 months after index admission compared with the prior 12 months (4.32 visits per patient before vs. 3.21 after, P < 0.05). In contrast, there were no significant differences in ED visits or readmissions for patients in the control cohort. Detailed HF-related readmissions and ED visits at 3, 6, and 12 months are given in Table 2.
FIGURE 3.
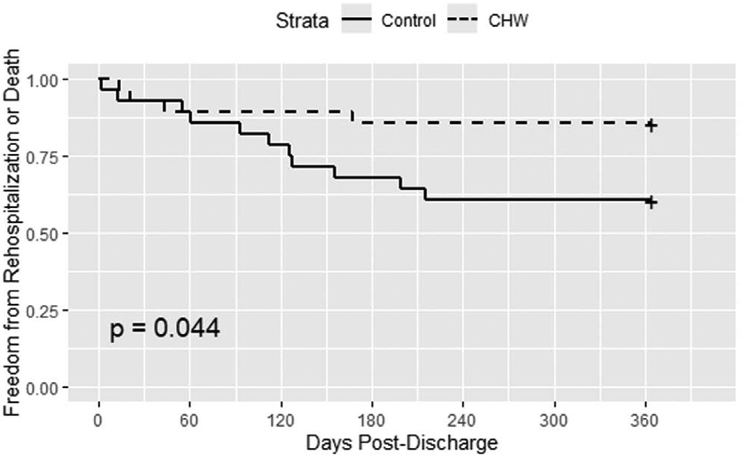
Freedom from HF-Related Rehospitalization or Death. Patients who were assigned a CHW had a significant reduction in the composite outcome of freedom from rehospitalization or death compared with controls (P < 0.05).
TABLE 2.
Readmissions and Emergency Department Visits
| Community Health Workers | Before | After | P | Control | Before | After | P |
|---|---|---|---|---|---|---|---|
| All-cause readmissions | All-cause readmissions | ||||||
| 3 months | 0.6786 | 0.4643 | 0.206 | 3 months | 0.6429 | 0.3571 | 0.141 |
| 6 months | 1.6786 | 1.3214 | 0.351 | 6 months | 0.8929 | 0.8929 | 0.812 |
| 12 months | 2.6786 | 2.0357 | 0.140 | 12 months | 1.2857 | 1.2500 | 0.851 |
| Heart failure readmissions | Heart failure readmissions | ||||||
| 3 months | 0.0714 | 0.0714 | 1.000 | 3 months | 0.2500 | 0.1071 | 0.276 |
| 6 months* | 0.3929 | 0.0714 | 0.008 | 6 months | 0.3571 | 0.2143 | 0.352 |
| 12 months* | 0.6429 | 0.0714 | 0.002 | 12 months | 0.6429 | 0.3214 | 0.108 |
| All-cause ED visits | All-cause ED visits | ||||||
| 3 months | 1.1071 | 1.0357 | 0.829 | 3 months | 0.8214 | 0.7500 | 0.772 |
| 6 months | 2.4286 | 2.1786 | 0.462 | 6 months | 1.2500 | 1.4286 | 0.691 |
| 12 months* | 4.3214 | 3.2143 | 0.034 | 12 months | 1.8571 | 2.0714 | 0.896 |
| Heart failure ED visits | Heart failure ED visits | ||||||
| 3 months | 0.0714 | 0.1429 | 0.572 | 3 months | 0.2857 | 0.0714 | 0.095 |
| 6 months* | 0.4286 | 0.1786 | 0.042 | 6 months | 0.3929 | 0.2500 | 0.493 |
| 12 months* | 0.7143 | 0.1786 | 0.003 | 12 months | 0.7143 | 0.3929 | 0.128 |
statistically significant (P < 0.05).
Cost Analysis
Patients in the CHW group experienced a significant decrease in inpatient costs for HF-related hospitalizations in the 12 months following enrollment in the program compared with prior ($14,637 ± 27,300 per patient before vs. $555.29 ± 2938 per patient after, P = 0.01). In contrast, no significant change was seen in the control patients ($7235 ± 11,767 per patient before vs. $4858 ± 10,552 per patient after, P = not significant). In fact, several control patients experienced an increase in total HF-related costs over the study period (6 of 28), whereas no CHW patients experienced an increase in cost (0 of 28, P < 0.05). Overall, patients in the CHW group experienced a relative cost savings of 63.3% compared with their peers in the control group with an estimated cost savings per patient of $4583. Based on these savings, each CHW would need to treat 12.8 patients per year to reach cost neutrality (assuming yearly salary of $58,500 including benefits).
DISCUSSION
In our study, we found that the use of CHWs in low-socioeconomic, urban, minority patients with HF was associated with lower health care utilization (decreased HF-related ED visits and readmissions) and health system costs in the 1 year following enrollment compared with the year prior, whereas controls showed no significant change. Further, the composite endpoint of freedom from HF-related rehospitalization or death was significantly improved in the CHW cohort compared with controls. These findings suggest that CHWs may further reduce health care utilization and improve outcomes for low-socioeconomic urban patients with HF who are already receiving guideline-directed care.
Our findings also suggest that CHWs may be a cost-effective and cost-beneficial method in managing HF in this population. Due to the significant decrease in readmissions and ED visits for patients assigned CHWs, inpatient costs (including ED costs) decreased substantially in the year following enrollment. Our findings suggest that over the course of 1 year, CHWs would have to care for about 13 patients for the program to be cost neutral. As payment models shift toward episodes of care, such as bundled payments, these low-cost providers may be a way for health systems to manage HF more cost-effectively.
Prior literature has suggested that patients in low-socioeconomic settings often have poor social support, due to a lack of close friends and family able to help them manage their chronic diseases.13 CHWs build rapport to become a “trusted friend” or “close family member” in these settings to provide education about disease management and community resources but also empower patients to be more proactive in managing their disease. Prior studies have shown that through these means, CHWs can reduce health care utilization, decrease costs, and improve clinical outcomes in chronic conditions such as cancer and asthma.3 Although other studies have found that CHWs are important additions to the HF care team in rural patients,14,15 our study is the first to demonstrate the effect of CHWs in the management of HF in low-socioeconomic, urban, racial minority patients who face strikingly different healthcare barriers from their rural peers.
Other studies utilizing CHWs in the management of various chronic diseases have produced mixed results regarding self-rated health but did show promise in reducing short-term rehospitalizations.6,7,23,24 Our study adds to this prior knowledge in that our study demonstrates durability of the effect of CHWs on rehospitalization for as long as 1-year postenrollment. Further, for HF patients specifically, our study population consisted primarily of patients with low-socioeconomic status (median household income ≈$32,000), a traditionally expensive group often with a lack of social support to manage their disease. The findings suggest that CHWs may play a role in empowering patients to more proactively manage their conditions and identify worrisome symptoms to prevent ED visits and readmissions.
Our study did have important limitations. First, patients who were enrolled in our study were not randomized and control patients were matched using a propensity score. However, using propensity score matching, the baseline characteristics, demographics, vital signs, laboratory findings, comorbid conditions, medication usage, household income, and prior health system utilization between the 2 groups were similar (Table 1). Also, based on limitations with institutional financial data, control patients were not matched by previous costs. Because of this, patients who received a CHW had higher healthcare costs in the year before enrollment than controls. These differences could have biased our study toward the null; therefore, the effect of CHWs in patients with HF may in fact be greater than what we observed. Our study is also limited by a small sample size owing to the long follow-up period, labor-intense intervention, and the availability of financial resources to support CHWs. Larger studies are needed to confirm these findings. Additionally, this was a retrospective study which cannot account for other quality improvement changes which are ongoing in our center,16 although patients in both groups were subject to these quality improvements equally. Notably, matched control patients were contemporaneous with their CHW peers, yet did not experience any significant change in readmissions, ED visits, or costs. Finally, all patients in this study were African American and lived within a region of Chicago with high-socioeconomic inequities. Although we view this as a strength of our study, it is not known if our findings can be extrapolated to other sociodemographic groups.
In conclusion, CHWs are associated with reduced readmissions, ED visits, and inpatient costs in low-socioeconomic urban patients with HF. CHWs may be a cost-effective method to reduce health care utilization and improve outcomes for patients with HF.
Supplementary Material
Acknowledgments
This study was funded by the Urban Health Initiative at the University of Chicago.
Footnotes
Supplemental digital content is available for this article. Direct URL citations appear in the printed text and are provided in the HTML and PDF versions of this article on the journal’s Web site (www.critpathcardio.com).
DISCLOSURES
Nothing to declare.
REFERENCES
- 1.Benjamin EJ, Virani SS, Callaway CW, et al. ; American Heart Association Council on Epidemiology and Prevention Statistics Committee and Stroke Statistics Subcommittee. Heart Disease and Stroke Statistics-2018 Update: are-port from the American Heart Association. Circulation. 2018;137:e67–e492. [DOI] [PubMed] [Google Scholar]
- 2.Ziaeian B, Kominski GF, Ong MK, et al. National differences in trends for heart failure hospitalizations by sex and race/ethnicity. Circ Cardiovasc Qual Outcomes. 2017;10:e003552. [DOI] [PMC free article] [PubMed] [Google Scholar]
- 3.Addressing chronic disease through community health workers: a policy and systems-level approach. Center for Disease Control National Center for Chronic Disease Prevention and Health Promotion;2015. [Google Scholar]
- 4.Kangovi S, Grande D, Trinh-Shevrin C. From rhetoric to reality–community health workers in post-reform U.S. health care. N Engl J Med. 2015;372:2277–2279. [DOI] [PMC free article] [PubMed] [Google Scholar]
- 5.Norris SL, Chowdhury FM, Van Le K, et al. Effectiveness of community health workers in the care of persons with diabetes. Diabet Med. 2006;23:544–556. [DOI] [PubMed] [Google Scholar]
- 6.Kangovi S, Mitra N, Grande D, Huo H, Smith RA, Long JA. Community health worker support for disadvantaged patients with multiple chronic diseases: arandomized clinical Trial. Am J Public Health. 2017;107:1660–1667. [DOI] [PMC free article] [PubMed] [Google Scholar]
- 7.Kangovi S, Mitra N, Grande D, et al. Patient-centered community health worker intervention to improve posthospital outcomes: a randomized clinical trial. JAMA Intern Med. 2014;174:535–543. [DOI] [PubMed] [Google Scholar]
- 8.Allen JK, Dennison Himmelfarb CR, Szanton SL, et al. Cost-effectiveness of nurse practitioner/community health worker care to reduce cardiovascular health disparities. J Cardiovasc Nurs. 2014;29:308–314. [DOI] [PMC free article] [PubMed] [Google Scholar]
- 9.Wilson FA, Villarreal R, Stimpson JP, Pagán JA. Cost-effectiveness analysis of a colonoscopy screening navigator program designed for Hispanic men. J Cancer Educ. 2015;30:260–267. [DOI] [PubMed] [Google Scholar]
- 10.Brownstein JN, Chowdhury FM, Norris SL, et al. Effectiveness of community health workers in the care of people with hypertension. Am J Prev Med. 2007;32:435–447. [DOI] [PubMed] [Google Scholar]
- 11.Gary TL, Bone LR, Hill MN, et al. Randomized controlled trial of the effects of nurse case manager and community health worker interventions on risk factors for diabetes-related complications in urban African Americans. Prev Med. 2003;37:23–32. [DOI] [PubMed] [Google Scholar]
- 12.Institute of medicine committee on understanding and eliminating racial and ethnic disparities in health C In: Smedley BD, Stith AY, Nelson AR, eds. Unequal Treatment: Confronting Racial and Ethnic Disparities in Health Care. Washington (DC): National Academies Press (US); 2003. [PubMed] [Google Scholar]
- 13.Durant RW, Brown QL, Cherrington AL, et al. Social support among African Americans with heart failure: is there a role for community health advisors? Heart Lung. 2013;42:19–25. [DOI] [PMC free article] [PubMed] [Google Scholar]
- 14.Reed PH, Hulton LJ. Community health workers in collaboration with case managers to improve quality of life for patients with heart failure. Prof Case Manag. 2017;22:144–148. [DOI] [PubMed] [Google Scholar]
- 15.Fawcett KJ Jr, Neff RK, Freese Decker CM, et al. Achieving IHI’s triple aim by utilizing core health program with community health workers in rural communities. Fam Community Health. 2018;41:255–264. [DOI] [PubMed] [Google Scholar]
- 16.Tabit CE, Coplan MJ, Spencer KT, et al. Cardiology consultation in the emergency department reduces re-hospitalizations for low-socioeconomic patients with acute decompensated heart failure. Am J Med. 2017;130:1112.e17–1112.e31. [DOI] [PMC free article] [PubMed] [Google Scholar]
- 17.Illinois Community Health Advisory Board Executive Summary In: Health IDoP, ed. 2015. [Google Scholar]
- 18.Kaplan RS, Anderson SR. Time-driven activity-based costing. Harv Bus Rev. 2004;82:131–8, 150. [PubMed] [Google Scholar]
- 19.Spiegel TF, Wassermann TB, Neumann N, et al. A clinical pathway for heart failure reduces admissions from the ED without increasing congestion in the ED. Am J Emerg Med. 2018;36:1202–1208. [DOI] [PubMed] [Google Scholar]
- 20.Harris PA, Taylor R, Thielke R, et al. Research electronic data capture (REDCap)–a metadata-driven methodology and workflow process for providing translational research informatics support. J Biomed Inform. 2009;42:377–381. [DOI] [PMC free article] [PubMed] [Google Scholar]
- 21.Donzé J, Aujesky D, Williams D, et al. Potentially avoidable 30-day hospital readmissions in medical patients: derivation and validation of a prediction model. JAMA Intern Med. 2013;173:632–638. [DOI] [PubMed] [Google Scholar]
- 22.Donzé JD, Williams MV, Robinson EJ, et al. International validity of the HOSPITAL score to predict 30-Day potentially avoidable hospital readmissions. JAMA Intern Med. 2016;176:496–502. [DOI] [PMC free article] [PubMed] [Google Scholar]
- 23.Morgan AU, Grande DT, Carter T, et al. Penn center for community health workers: step-by-step approach to sustain an evidence-based community health worker intervention at an academic medical center. Am J Public Health. 2016;106:1958–1960. [DOI] [PMC free article] [PubMed] [Google Scholar]
- 24.Sevilla-Cazes J, Ahmad FS, Bowles KH, et al. Heart failure home management challenges and reasons for readmission: a qualitative study to understand the patient’s perspective. J Gen Intern Med. 2018;33:1700–1707. [DOI] [PMC free article] [PubMed] [Google Scholar]
Associated Data
This section collects any data citations, data availability statements, or supplementary materials included in this article.