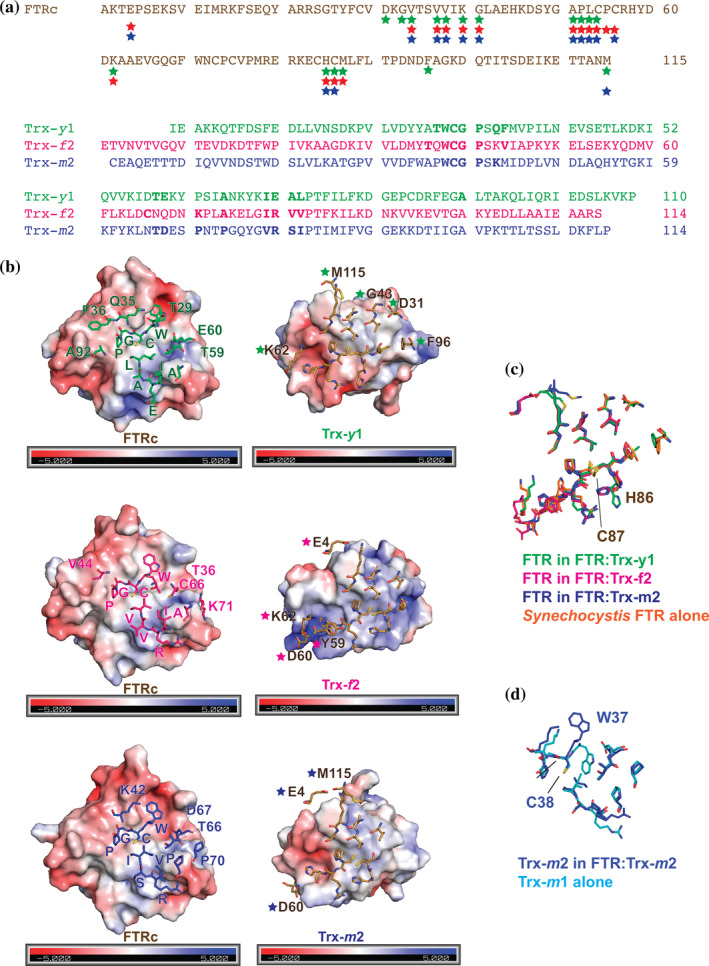
FIGURE 2.

Structural comparison of the three FTR:Trx complexes. (a). Amino acid sequence alignment of the catalytic subunit of FTR (upper) and the three Trx isoforms (bottom). A colored star below the FTR sequence indicates that the corresponding residue interacts with the Trx molecule. Color code for the stars are as follows: green for Trx‐y1, magenta for Trx‐f2, or blue for Trx‐m2. A bold letter in the Trx sequences indicates that the residue is involved in interaction with FTR. (b). The molecular surfaces of FTR and Trx colored according to the electrostatic potentials are shown in open‐book style with interacting residues shown as stick models. A one letter code with a sequence number correspond to isoform‐specific residues. (c). Superimposed models of FTR in the three complexes and Synechocystis FNR alone (1DJ7). (d). Superimposed models of Trx‐m
