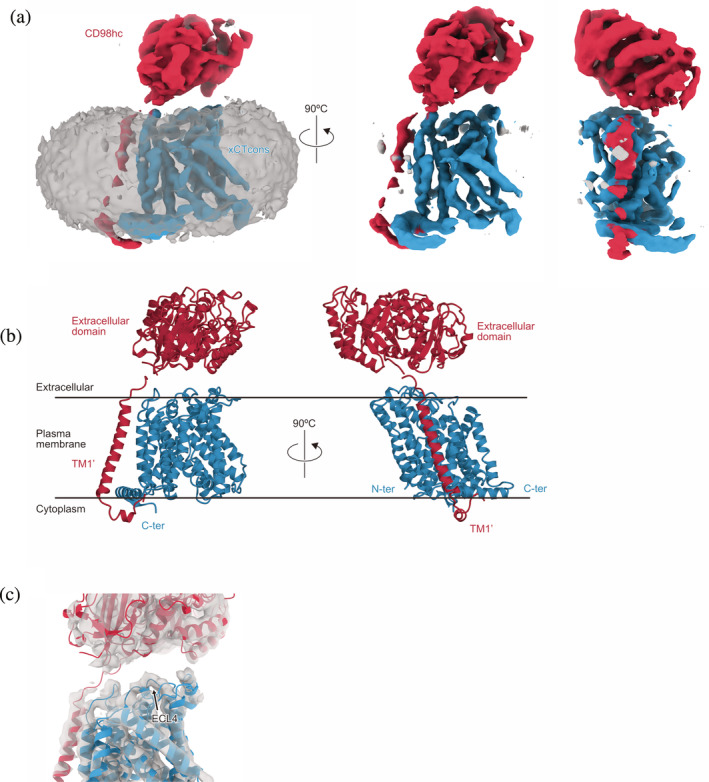
FIGURE 3.

Overall structure of the xCTcons‐CD98hc complex. (a) Cryo‐EM map of the xCTcons‐CD98hc complex. Map segments are colored according to the subunits. The blue segment represents xCTcons, the red segment represents CD98hc, and the grey segment represents the micelle. (b) Cartoon model of xCTcons‐CD98hc, with xCTcons (blue) and CD98hc (red). (c) Structural model of the xCTcons‐CD98hc complex in the cryo‐EM density map. The grey portion represents the cryo‐EM map. xCTcons (blue) and CD98hc (red) are shown as cartoon models
