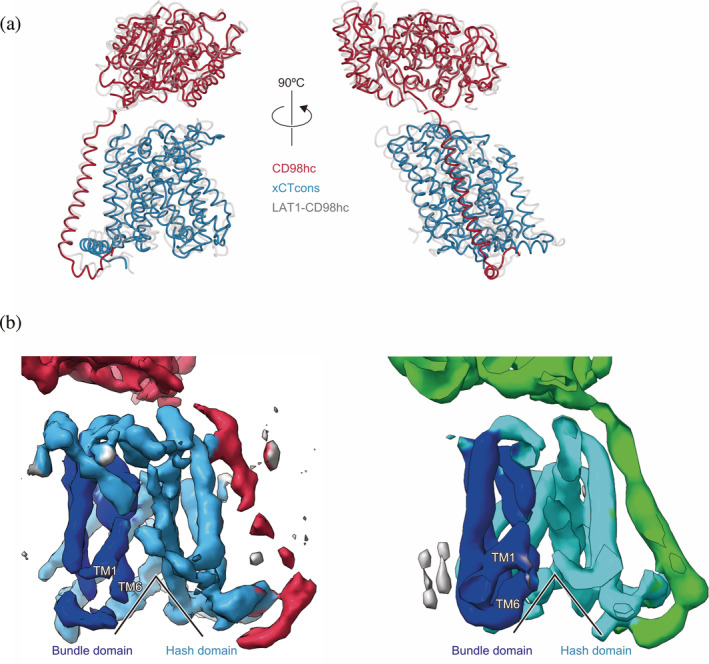
FIGURE 4.

Structural and cryo‐EM map comparisons with the LAT1‐CD98hc complex. (a) Structural comparison with the LAT1‐CD98hc complex. The xCTcons and CD98hc proteins are colored as in Figure 3. The LAT1‐CD98hc complex is colored grey. (b) Cryo‐EM map comparison with the LAT1‐CD98hc complex. The left map represents xCTcons‐CD98hc and the right map represents the 7.0 Å low‐pass filtered LAT1‐CD98hc complex. In the maps, the bundle domain is blue, the hash domain is cyan, and CD98hc is red or green. The black line indicates that both structures are in the inward‐facing conformations
