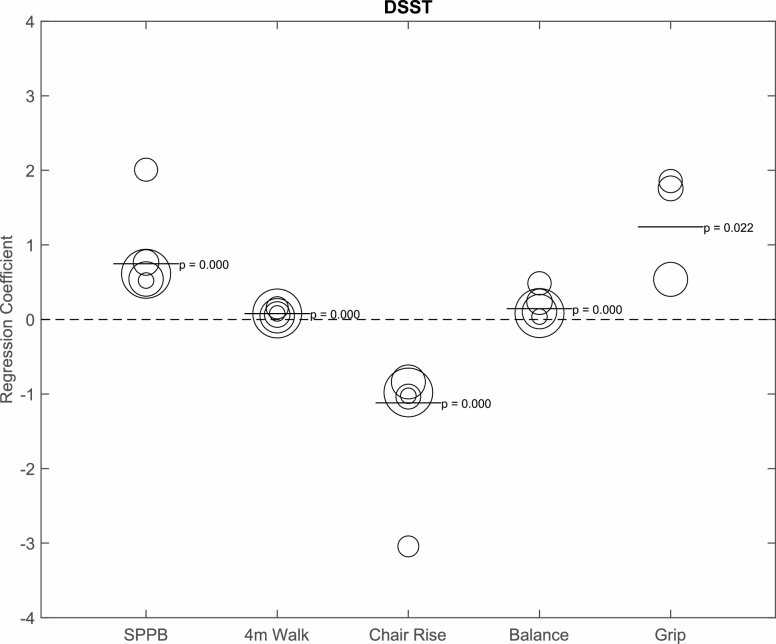
Figure 3.
Bubble plot depicting the relationship between Digit Symbol Substitution Test (DSST; per SD) and physical function, adjusted for age, sex, race, and body mass index. The bubble size represents the size of the sample. The bar represents the combined regression coefficient and p value. SPPB = Short Physical Performance Battery.

