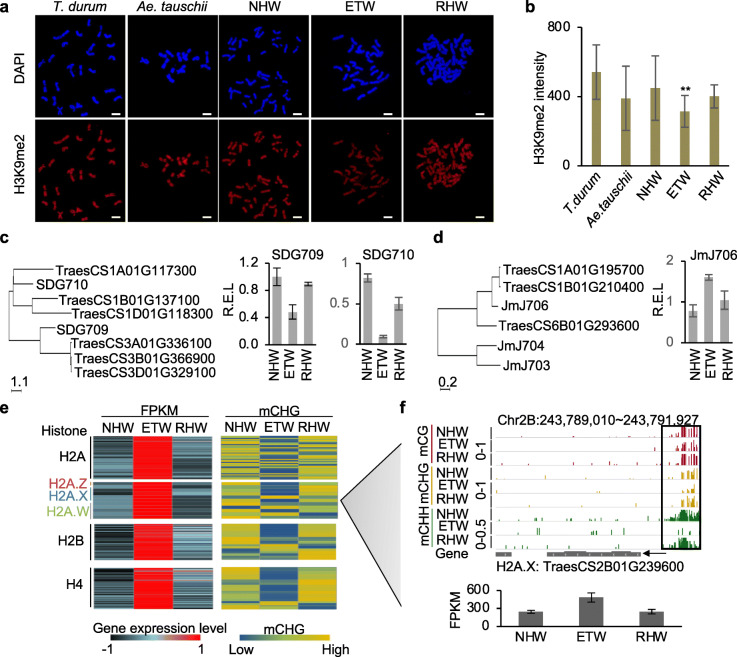
Fig. 5.
Upregulation of H3K9me2 demethylase genes and histone genes and downregulation of H3K9me2 methyltransferase genes in ETW. a Representative immunofluorescence images with antibodies against H3K9me2 in metaphase cells of five wheat species. Scale bar = 10 μm. b Relative immunofluorescent intensities of H3K9me2 per chromosome for samples in a. Error bars indicate standard deviation with double asterisks showing a significance level of P < 0.01. c Two H3K9me2 histone methyltransferase genes SDG710 and SDG709 in rice and homoeologs in wheat with their expression levels in NHW, ETW, and RHW. d Histone H3K9me2 demethylase genes (JMJ706 and its related genes) in rice and wheat with expression levels in NEW, ETW, and RHW. e Heatmaps show gene expression levels (left) and CHG methylation levels in promoter regions (right) of upregulated histone H2A, H2B, and H4 genes in ETW. f An example showing hypomethylation and upregulation of an H2A gene in ETW. The box indicates the DMR region. Scales are 0–1 for CG and CHG and 0–0.5 for CHH

