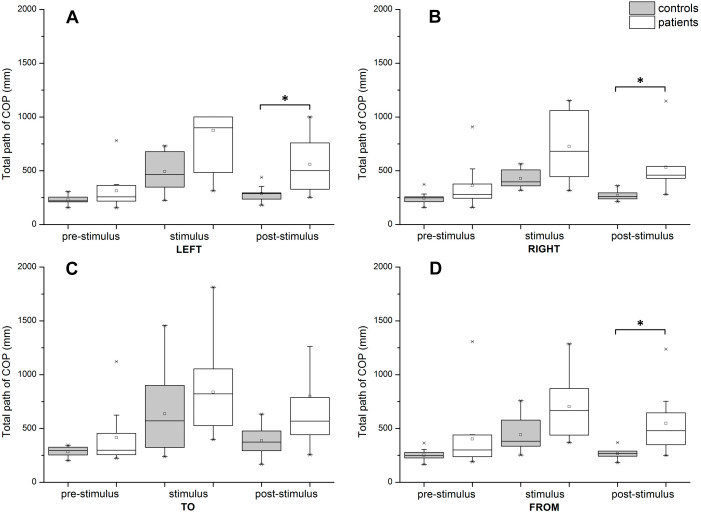
Figure 4. Post-hoc t-tests comparing TP of COP between groups during pre-stimulus, stimulus, and post-stimulus periods.
(A) Scene rotating to the left. (B) Scene rotating to the right. (C) Scene moving to subject. (D) Scene moving away from the subject. Significant differences (p ≤ 0.0167) are marked with asterisks. In post-stimulus period, for direction to the left p = 0.009, for right p = 0.007 and for direction from the subject p = 0.012.

