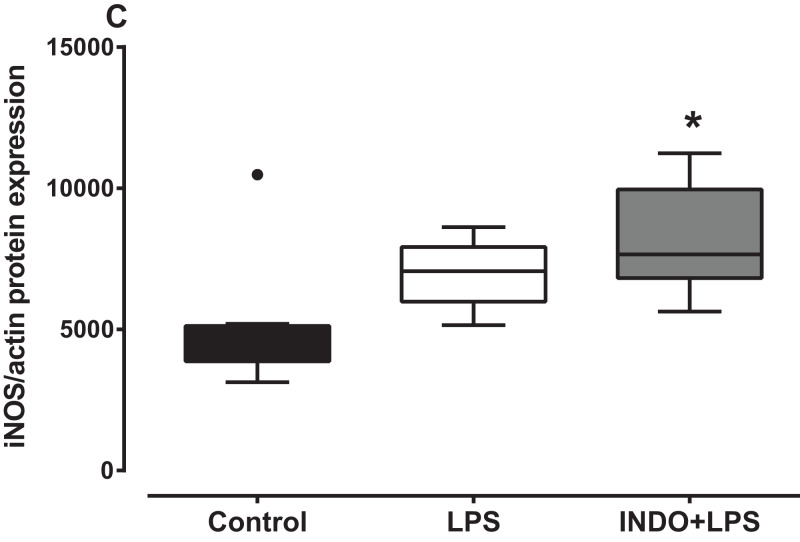
Figure 3. Effect of treatment with indomethacin followed by LPS-induced inoculation on iNOS protein expression.
Protein expression of iNOS in the brains of uninoculated control, LPS-inoculated vehicle-treated and LPS-inoculated indomethacin-treated mice at 4 h post inoculation. Each box and whiskers represents the median and interquartile range of the values obtained from six to eight animals. The dot above the control shows an outlier value. *p < 0.05 compared to vehicle-treated control (Kruskal–Wallis test followed by Dunn’s multiple comparison test).

