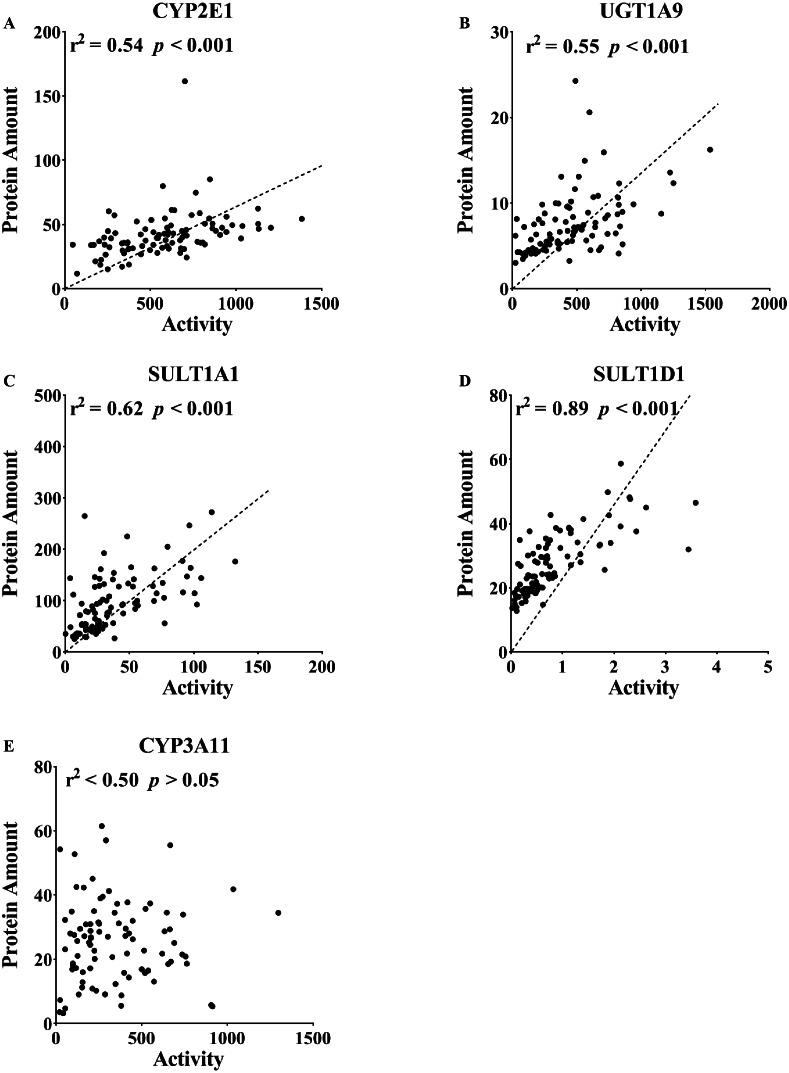
Figure 4. Correlation between the protein expression and activity of (A) CYP2E1, (B) CYP3A11, (C) UGT1A9, (D) SULT1A1 and (E) SULT1D1 in the liver tissue (n = 100).
The correlation between the protein expression and activity included 5, 10, 15, 20 and 26 weeks, which were analyzed together. DME in the liver was determined using an isotope label-free LC-MS/MS method. The enzyme activities of DMEs were measured using probe substrates. All measurements were performed in triplicate and the data are presented as the mean ± SD. Pearson product correlation and Spearman’s rank correlation were used to analyze the correlation. Regression line is shown for significant correlation at p < 0.05.

