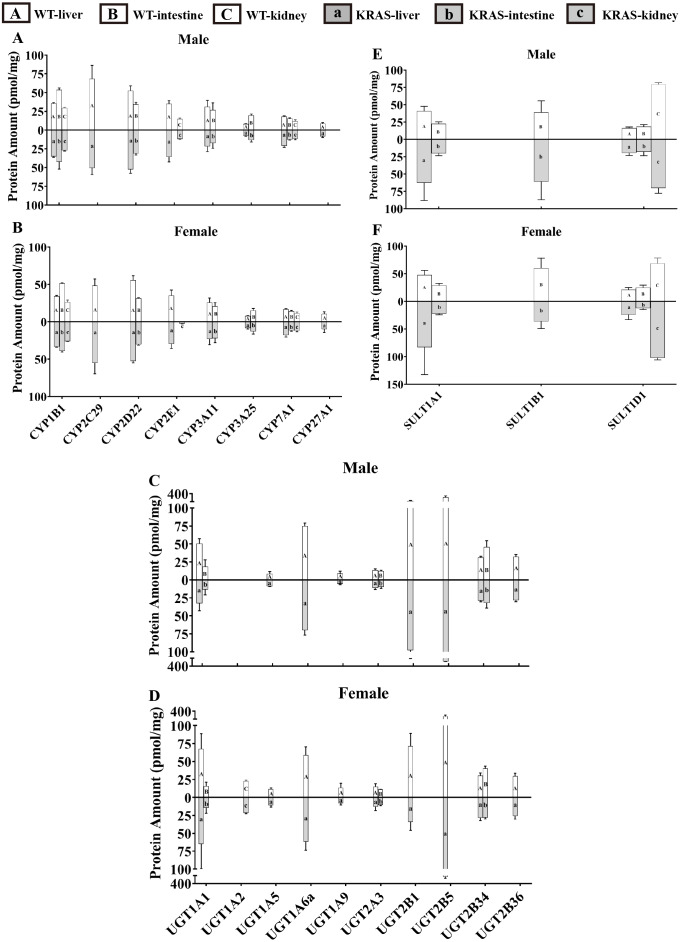
Figure 6. Protein content of DMEs in different tissues from the KRAS and WT mice with different sexes at 10 weeks, n = 5.
All measurements were performed in triplicate and the data are presented as the mean ± SD. (A–B) Protein levels of eight CYP isoforms in different tissues from the KRAS and WT mice with different sexes. (C–D) Protein levels of 10 UGT isoforms in different tissues from the KRAS and WT mice with different sexes. (E–F) Protein levels of three SULT isoforms in different tissues from the KRAS and WT mice with different sexes.

