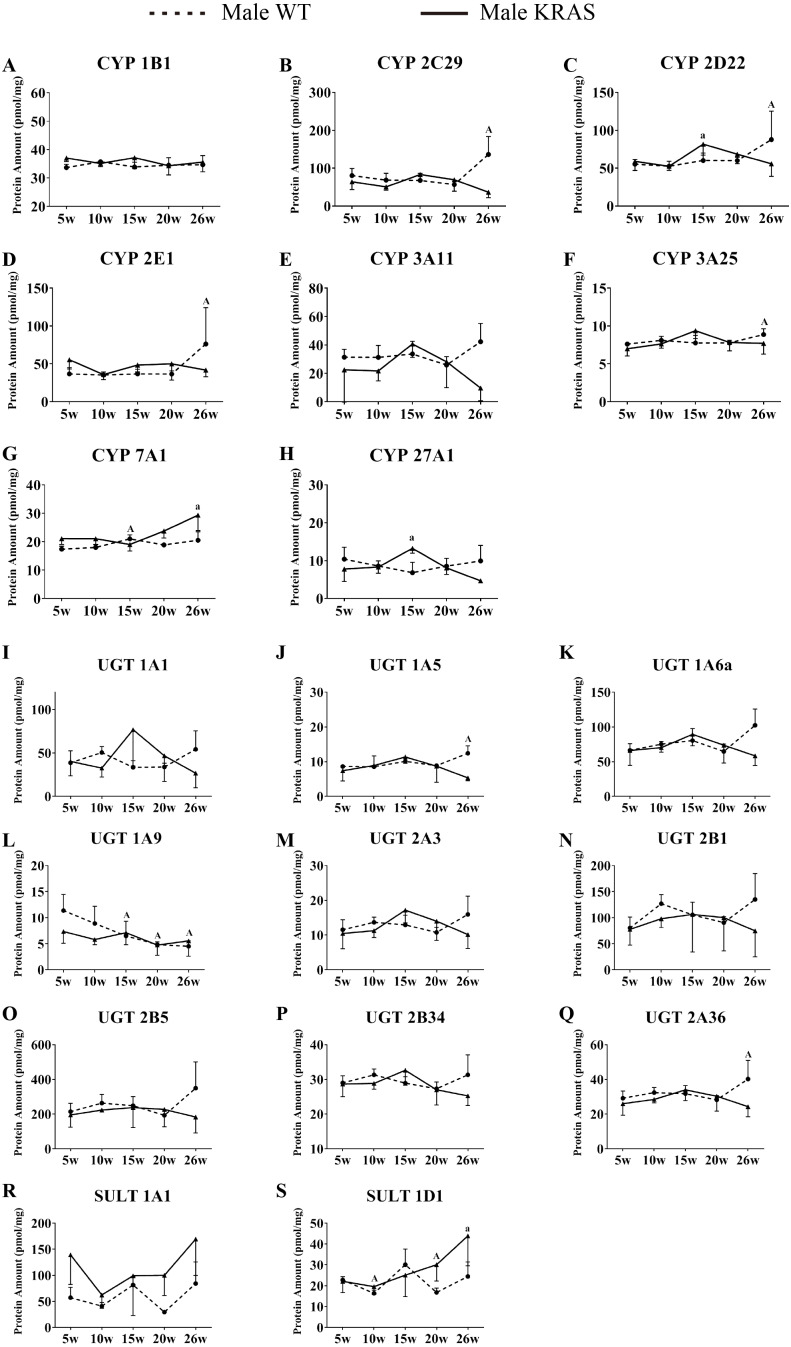
Figure 7. Alterations in protein levels of eight CYPs, nine UGTs and two SULTs at different ages in the liver of male KRAS and WT mice, n = 5.
The dotted and solid lines represent the WT and KRAS mice, respectively. Each data point represents the mean ± SD. The data were analyzed by one-way ANOVA (for normally distributed data) and Kruskal–Wallis H analysis (for non-normally distributed data). We adjusted the significance level α to 0.0125 according to the Bonferroni correction (0.05/4=0.0125). The symbols “A” and “a” indicate significant differences in the male WT and KRAS mice at 10, 15, 20 and 26 weeks relative to 5 weeks, p < 0.0125.

