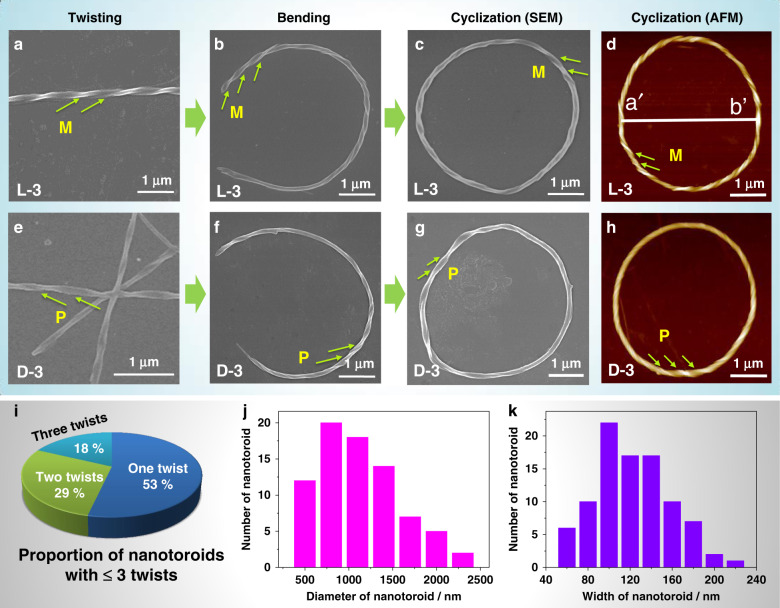
Fig. 2. Bending and cyclization processes of twisted nanofibers revealed by electron microscopic images and statistical analysis of chiral toroidal fibers.
SEM and AFM images of L-3 self-assemblies showing M chirality. a Linear twisted fiber. b Semicircle shaped twisted fiber. c, d Chiral toroidal fibers, the diameter (a′–b′) of toroid showed in (d) is about 4.0 μm. SEM and AFM images of D-3 self-assemblies showing P chirality. e Linear twisted fiber. f Semicircle shaped twisted fiber. g, h Chiral toroidal fibers. [L-3] = [D-3] = 0.11 mM, pH = 3 for (a) and (e), pH = 2 for (b–d) and (f–h). Notes: M means left helicity and P means right helicity. i–k Statistical analysis of morphological properties of nanotoroids observed from SEM images of L-3 self-assemblies (total number of nanotoroids analyzed, 95). i Proportion of nanotoroids with ≤3 twists on the toroidal fibers, the number of toroids with one, two, and three twists are 16, 8, and 5, respectively. j The frequency distribution histogram is plotted against the diameter of nanotoroids. k The frequency distribution histogram is plotted against the width of nanotoroids.

