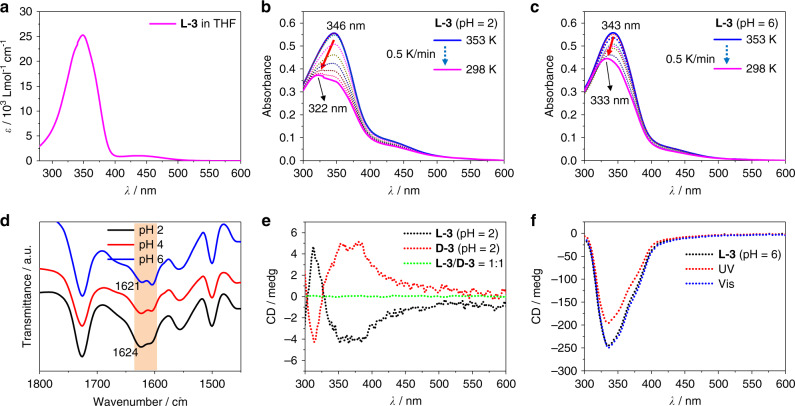
Fig. 4. Spectroscopic study of amphiphile self-assembly.
a UV–vis spectrum of L-3 amphiphile in THF. [L-3] = 50 μM, 298 K, εmax = 2.5 × 10⁴ M−1 cm−1 at 348 nm. b Variable-temperature UV–vis spectra of L-3 amphiphile in water. [L-3] = 50 μM, pH = 2. Cooling speed is 0.5 K/min, data interval is 5 K/record. c Variable-temperature UV–vis spectra of L-3 amphiphile in water. [L-3] = 50 μM, pH = 6. Cooling speed is 0.5 K/min, data interval is 5 K/record. d FT-IR spectra of self-assemblies of L-3 amphiphile in water at different pH values, blue line: pH = 6, red line: pH = 4, black line: pH = 2, [L-3] = 0.11 mM. e CD spectra of self-assemblies of L-3 (black dotted line), D-3 (red dotted line) and their 1:1 mixture (green dotted line), [L-3] = [D-3] = 50 μM, pH = 2. f CD spectra of self-assemblies of L-3, [L-3] = 50 μM, pH = 6, black dotted line: normal L-3 assemblies, red dotted line: L-3 assemblies after UV 365 nm irradiation for 1 h, blue dotted line: L-3 assemblies after visible light irradiation for 1 h.

