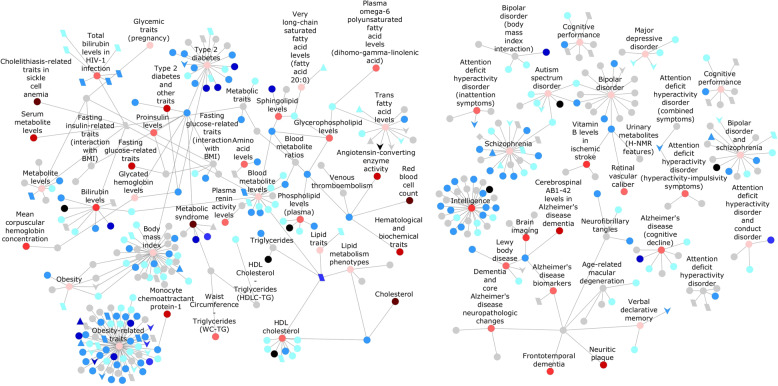
Fig. 6. Network of palindrome-associated GWAS SNPs and their connection to various diseases.
Diseases that are associated with GWAS SNPs with palindrome changes in 1000 Genomes are shown as round nodes with labels. Their size represents the overall number of SNPs associated with that disease. Their color represents the percentage of their SNPs that are palindrome altering: gray (0–8%), light pink (8–12%), medium pink (12–25%), light red (25–50), medium red (50–75%), and dark red (75–100%). For example, the trait “height” has more SNPs associated with it compared to “multiple sclerosis” (node size); however, a larger percentage of multiple sclerosis SNPs are palindrome-altering (node color). The specific SNPs that alter palindromes are shown as unlabeled nodes, in which SNPs that convert a palindrome to a non-palindrome are shown as diamond-shaped nodes; SNPs that create new palindromes are shown as parallelogram-shaped nodes; SNPs that lengthen the palindromes are shown as triangle-shaped nodes; SNPs that shorten the palindromes are shown as v-shaped nodes; and SNPs that alter palindromes in other ways (non-identical, near-to-perfect or perfect-to-near) are shown as round-shaped nodes. These nodes that represent SNPs are colored by their RegulomeDB scores: black (score = 1), dark blue (2), medium blue (3), light blue (4 and 5), very light blue (6), and gray (0). The network diagram was made using Cytoscape50.

