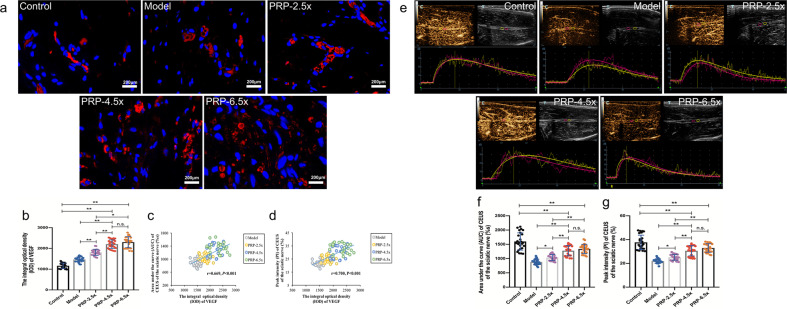
Fig. 5. VEGF staining and CEUS detection on the regenerative vessels at 12 weeks post-operation (n = 5/group).
a Vessels were stained with VEGF (red), and nuclei were stained with DAPI (blue) in the control group, model group, PRP-2.5× group, PRP-4.5× group and PRP-6.5× group. b The statistical analyses of the mean IOD of VEGF on the operated side. c The correlation analysis between AUC of CEUS and the IOD of VEGF. f The correlation analysis between the PI of CEUS and the IOD of VEGF. e CEUS examination of injured nerve on the operated side. The enhanced time was shown in the horizontal axis and the enhanced intensity was shown in the vertical axis. The time-intensity curves (proximal: pink and distal: yellow) of the CEUS obtained for the control group, model group, PRP-2.5× group, PRP-4.5× group and PRP-6.5× group. f Comparisons of the AUC on the CEUS in the operated sciatic nerve among groups. g Comparisons of the PI on the CEUS in the operated sciatic nerve among groups. *P < 0.05, **P < 0.01, and n.s. not significant. Error bars = SD, n = 5. CEUS contrast-enhanced ultrasonography, PRP platelet-rich plasma, IOD integral optical density, AUC area under the curve, PI peak intensity.

