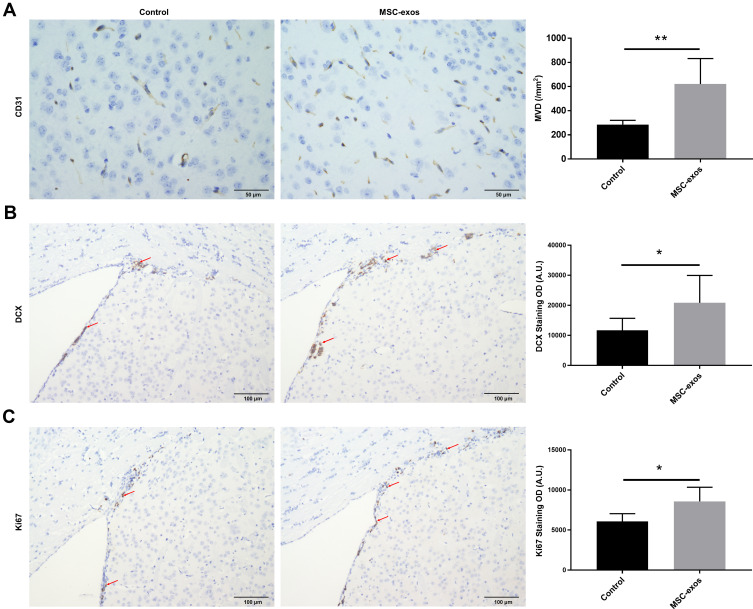
Figure 4.
Exogenous MSC-exos increased angiogenesis and neurogenesis after stroke. (A) Representative images of CD31 staining in the IBZ and quantitative data of MVD on day 14. (B) Representative images of DCX staining in the SVZ and quantitative data on day 14. (C) Representative images of Ki67 staining in the SVZ and quantitative data on day 14. n=8-10/group. *p<0.05, **p<0.01.

