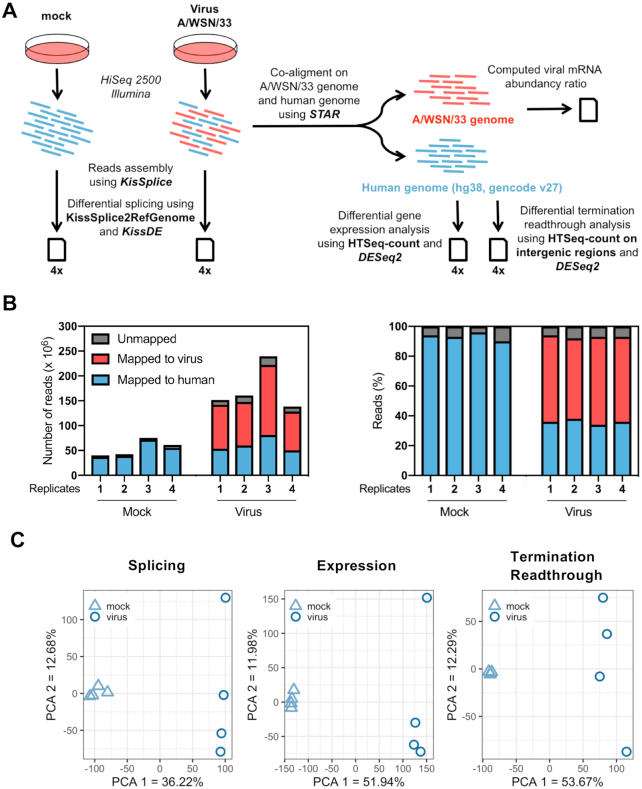
Figure 1.
Dual RNA-seq analysis of IAV-infected cells. (A) Schematic representation of the dual RNA-seq analysis pipeline. Illumina reads corresponding to viral and cellular mRNAs are represented in red and blue, respectively. (B) Mapping of Illumina sequencing reads. The left panel shows the number of reads mapped to the A/WSN/33 virus genome (red), the human genome (blue) or unmapped (gray) for each technical replicate. In the right panel, the same data are shown as percentages of the total number of reads. (C) PCA on PSI values (left panel), normalized gene counts (middle panel) and normalized intergenic counts (right panel). The samples corresponding to each experimental condition (four biological replicates per condition) were plotted on the first two principal components.

