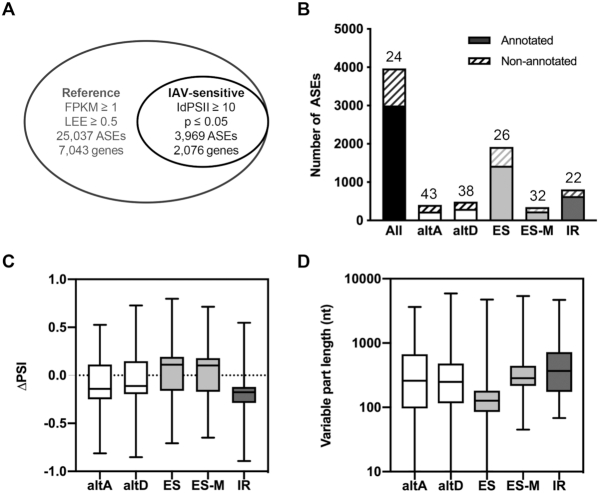
Figure 2.
Global alterations of the cellular splicing landscape upon IAV infection. (A) Filtering of the ASE dataset. Out of the >66 000 ASEs that were analyzed by kissDE, the 25 037 ASEs showing FPKM ≥ 1 and LEE ≥ 0.5 in the mock-infected and/or IAV-infected condition were considered as the reference splicing dataset (outer circle). Upon additional filtering for |ΔPSI| ≥ 10% and P ≤ 0.05, 3969 differentially regulated ASEs were identified (IAV-sensitive splicing dataset, inner circle). (B) Number of annotated (plain bars) and non-annotated (hatched bars) events in the IAV-sensitive splicing dataset. The percentage of non-annotated events for each of the indicated types of ASE is indicated above. (C-D) Box plots showing the distribution of ΔPSI values (PSIIAV-infected − PSImock-infected) (C) or the distribution of the lengths in nucleotides of the variable part (D), for each of the indicated type of ASE within the IAV-sensitive splicing dataset. The median values are shown as a line in the center of the boxes.

