Figure 4.
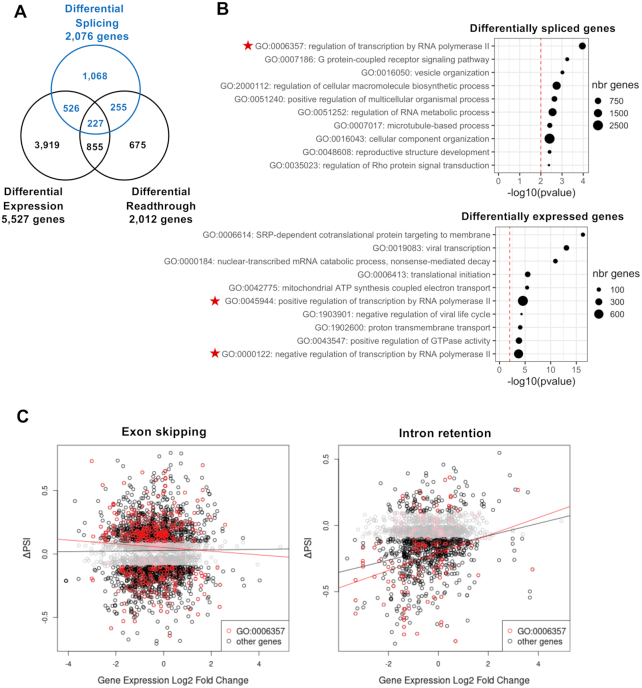
Cross-analysis of splicing alterations and other transcriptional changes induced by IAV infection. (A) Venn diagram representing the sets of genes showing differential splicing, expression and/or readthrough upon IAV infection. (B) GO analysis. The top 10 GO terms most enriched among the genes differentially spliced in the CDS (upper panel) or the genes differentially expressed (lower panel) are indicated. The dot size is proportional to the number of genes annotated with the GO term in the full genome, as indicated. (C) Plot representing ΔPSI as a function of the log2 FC value, for differentially spliced ES events (left panel) and IR events (right panel). Each dot represents a distinct splicing event. Regression curves are shown. Black curve: all splicing events. Red dots and curve: splicing events related to genes annotated with the GO term ‘Regulation of transcription by RNA polymerase II’ (GO0006357).

