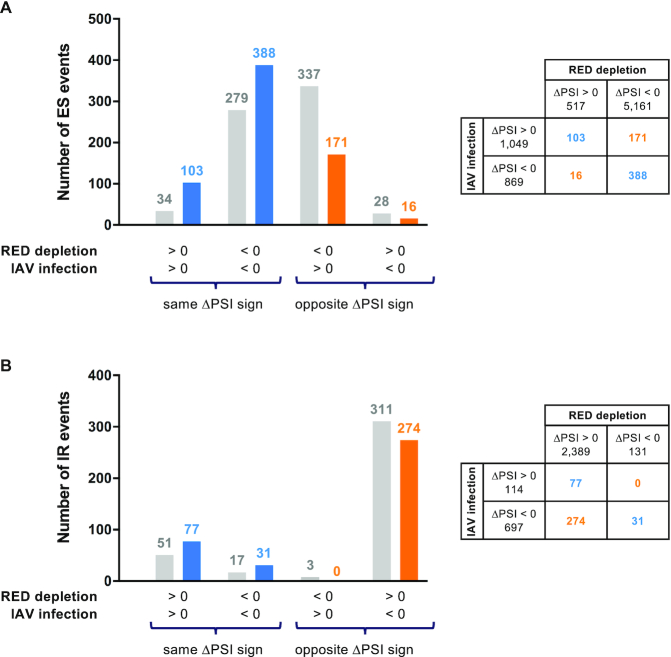
Figure 5.
Overlap of IAV-sensitive and RED protein-controlled splicing events. The numbers of ES (A) and IR (B) events that are dysregulated upon both IAV infection and RED depletion are indicated in a chart, and compared with those expected under the null hypothesis that the two variables are independent, according to the sign of ΔPSI in each condition. Blue color: ΔPSI of same sign; orange color: ΔPSI of opposite sign; gray color: expected numbers.

