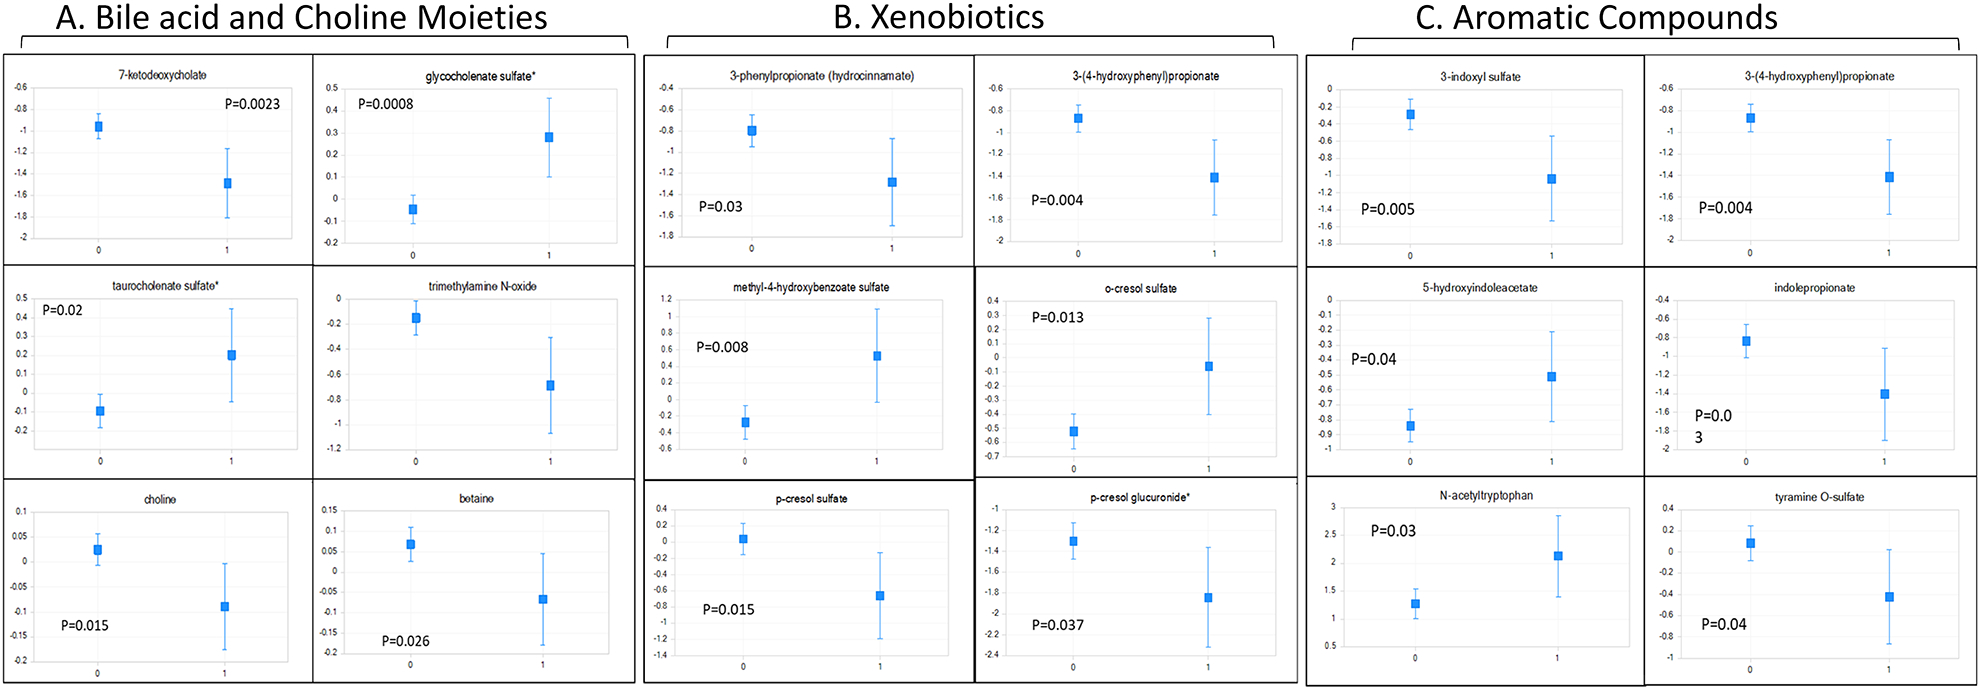
Figure 1: ACLF-Related Serum Metabolites.

Least square means of ANCOVA-corrected microbial-origin metabolites presented as mean and 95% CI between patients who did (marked as 1) and did not develop ACLF (marked as 0). A: Bile acids and Choline moieties, B: Aromatic compounds and C: Xenobiotics. Y axis: scaled intensity. FDR-corrected p values are shown for each metabolite.
