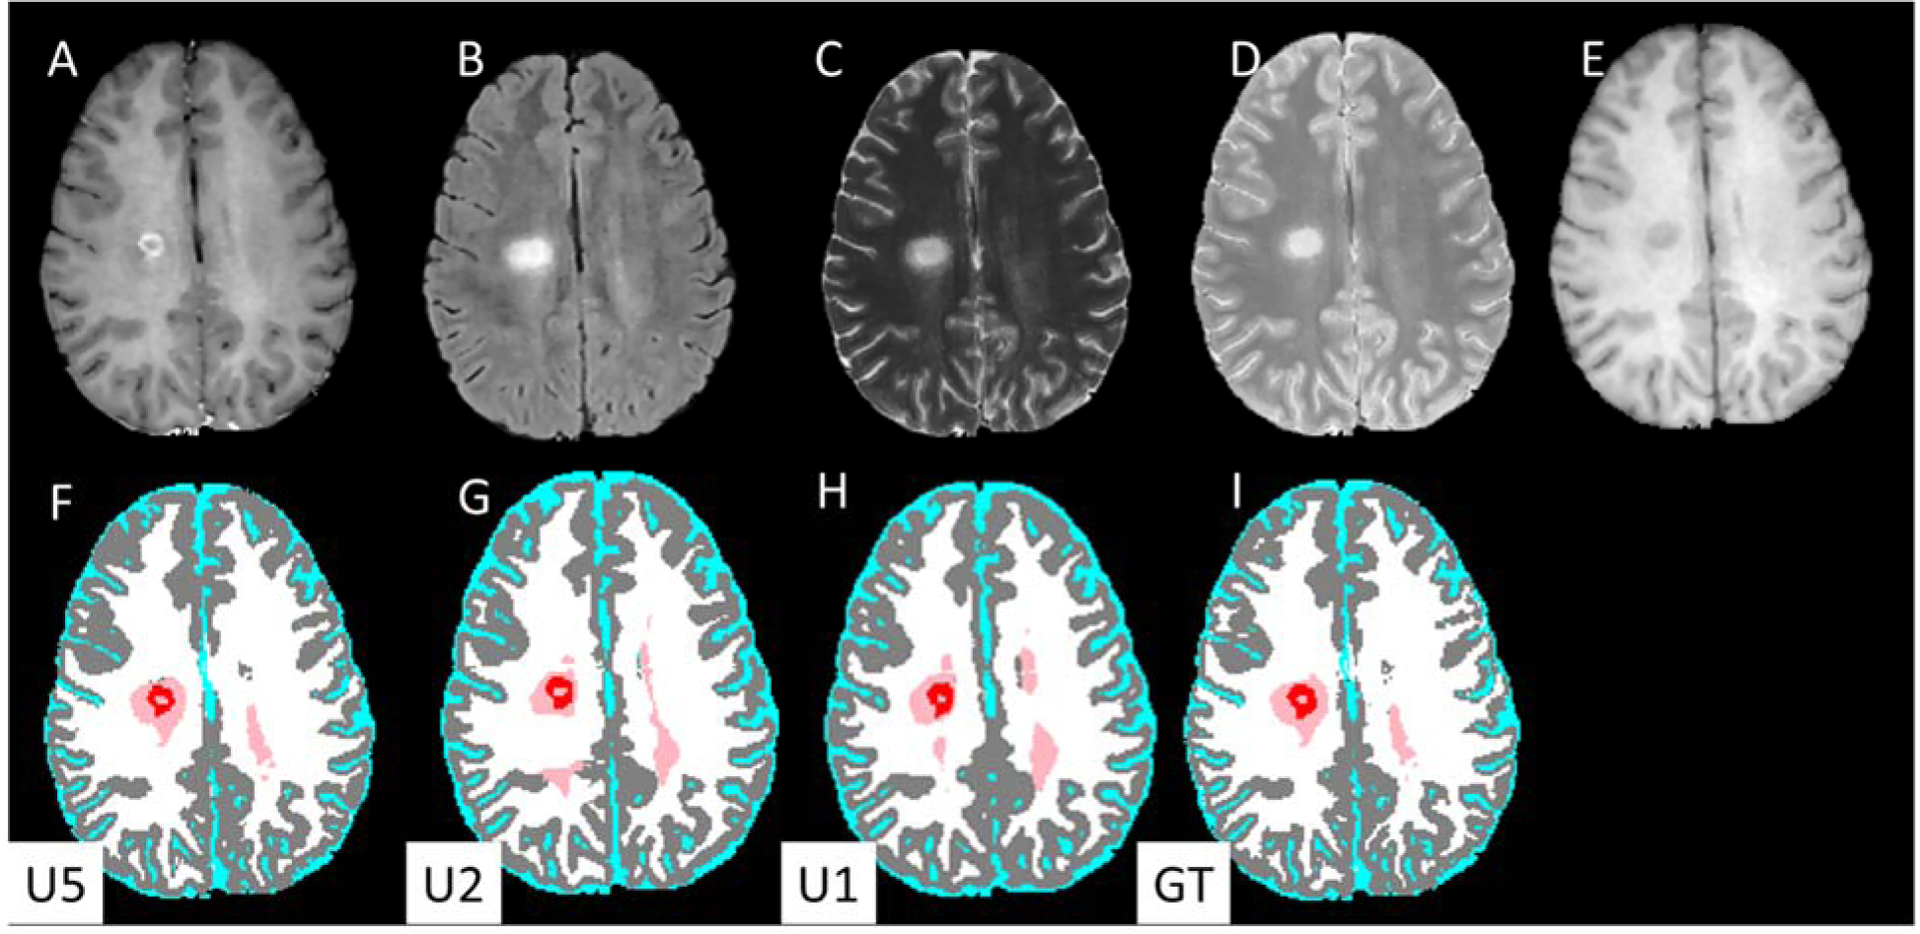
Figure 2.

Input MR images (upper row) and DL segmented images (lower row). (A) post-Gd T1w, (B) FLAIR, (C) T2-weighted, (D) PD-weighted, (E) T1-weighted images. Segmentation maps with (F) U5 (G) U2, (H) U1 models, and (I) ground truth. The segmentation maps are color-coded as: white, WM; gray, GM, cyan, CSF; pink, T2 lesions; red, Gd-enhancing lesions.
