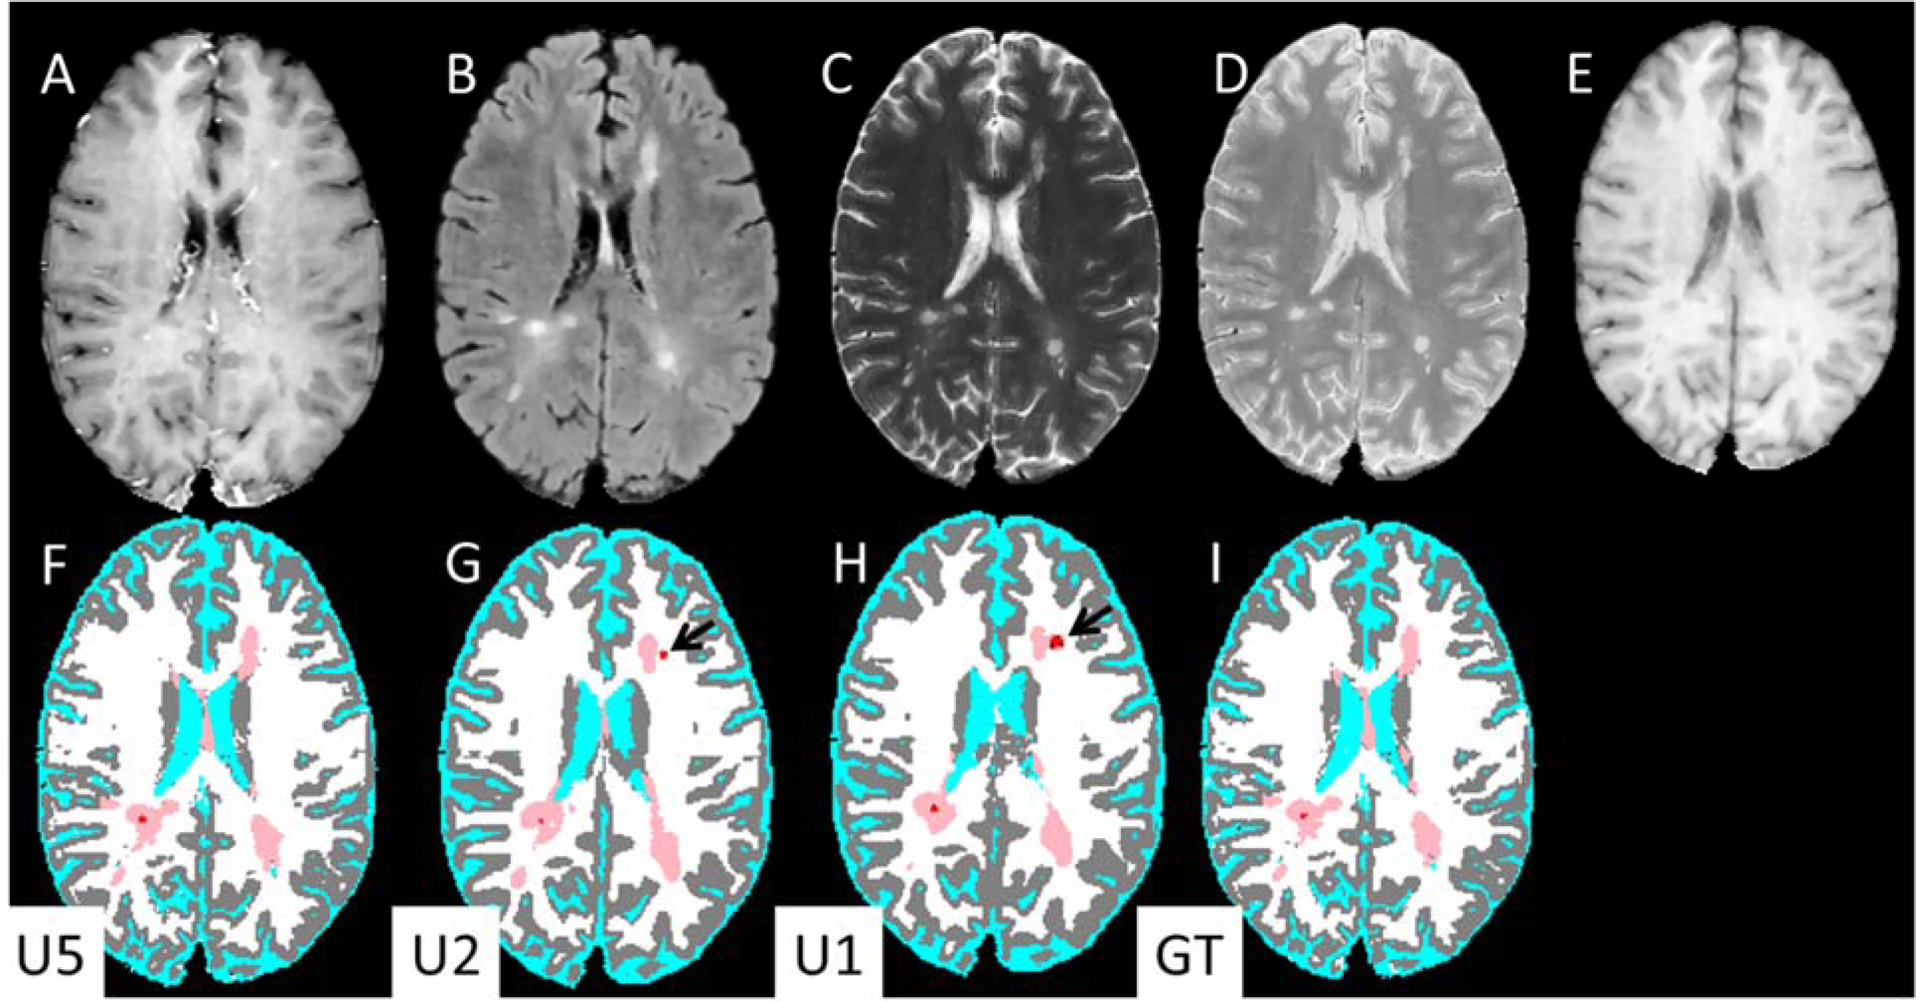
Figure 4.

Input MR images (upper row) and DL segmentation (lower row). (A) post-Gd T1-weighted, (B) FLAIR, (C) T2-weighted, (D) PD-weighted, (E) pre-contrastT1-weighted images. Bottom row: segmentation maps based on: (F) U5, (G) U2, (H) U1, and (I) Ground truth. The segmentation maps are color-coded as in Fig. 2. Note the Gd-enhancing lesions segmented by U1 and U2 (black arrows) are absent from U5.
