
Figure 5.
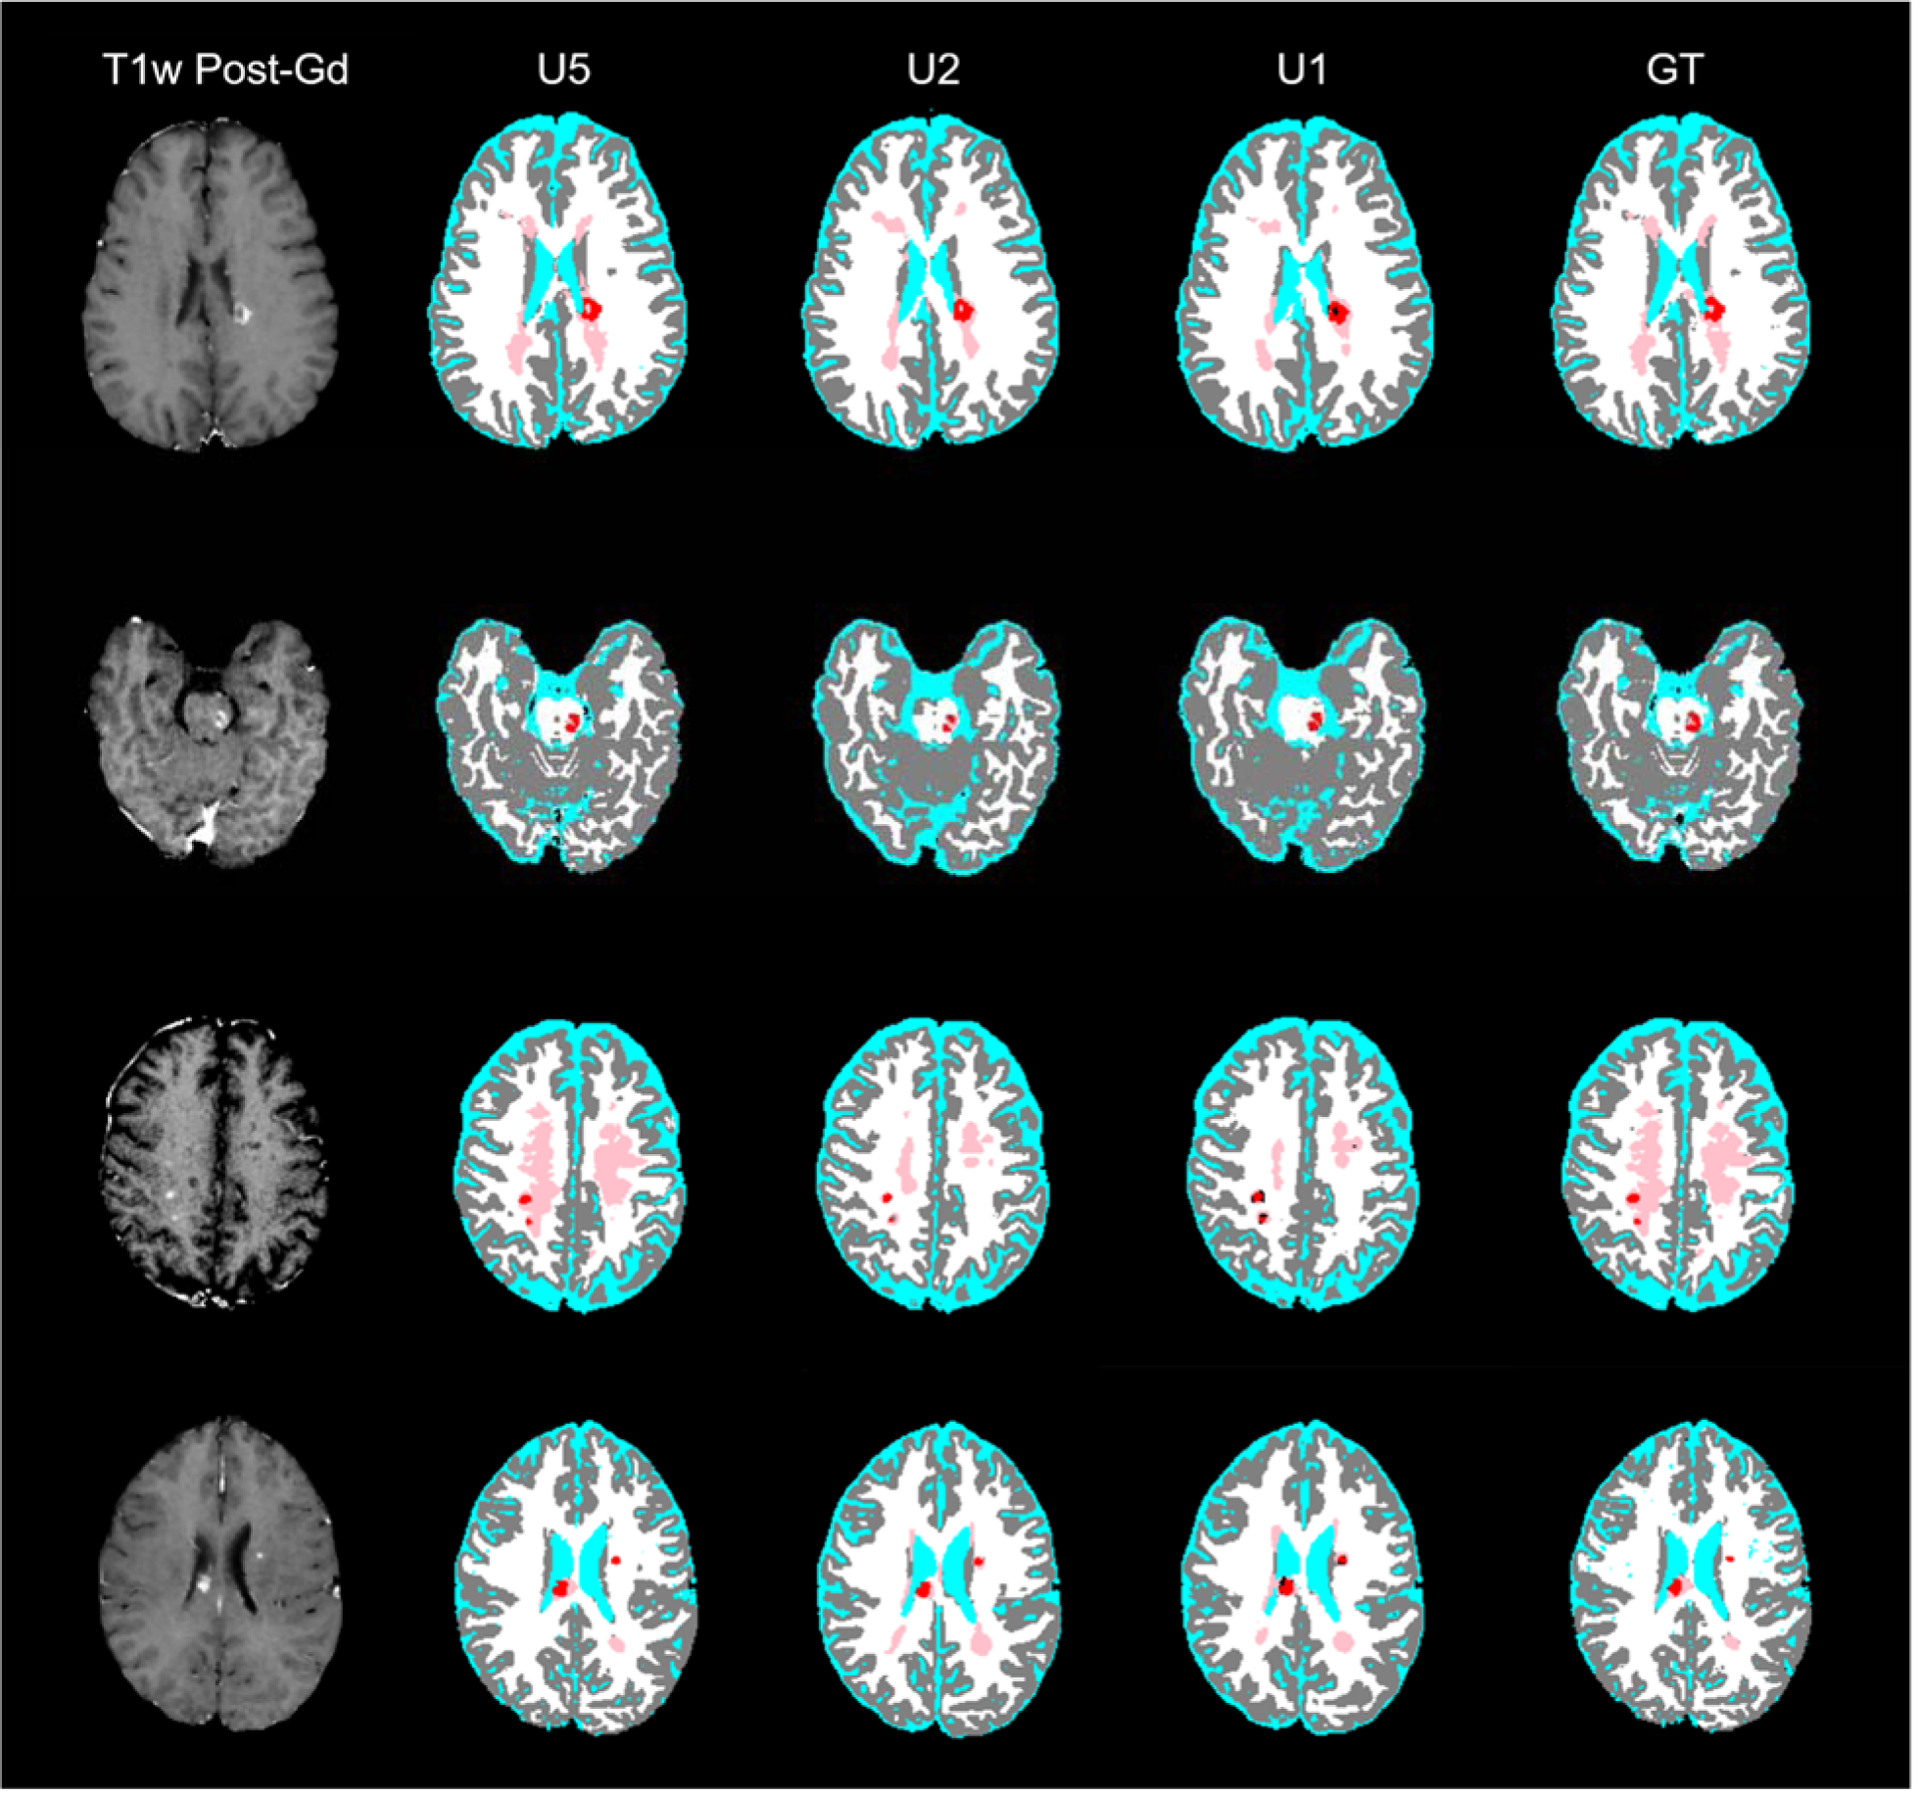
Post-Gd T1w images (left column) and DL model segmentation (columns 2–4) and ground-truth segmentation (right column) from four MS patients (rows). The segmentation maps are color-coded as in Fig. 2.
Official websites use .gov
A
.gov website belongs to an official
government organization in the United States.
Secure .gov websites use HTTPS
A lock (
) or https:// means you've safely
connected to the .gov website. Share sensitive
information only on official, secure websites.
Post-Gd T1w images (left column) and DL model segmentation (columns 2–4) and ground-truth segmentation (right column) from four MS patients (rows). The segmentation maps are color-coded as in Fig. 2.