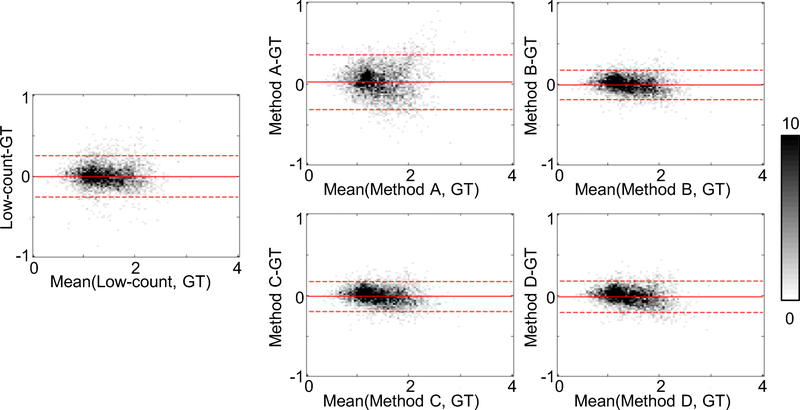
Figure 5.
Bland-Altman 2-D histograms of regional standardized uptake value ratios (SUVRs) compared between methods (ground-truth to low-count and methods A, B, C, and D) across all datasets with FreeSurfer segmentations (n=37). The scale bar denotes the number of data points in each pixel; the solid and dashed lines denote the mean and 95% confidence interval of the SUVR differences respectively. GT: ground-truth. Network training methods: A-direct application of pre-trained network; B-transfer learning starting with pre-trained network; C-training new network from scratch; D-training new network with combined datasets

