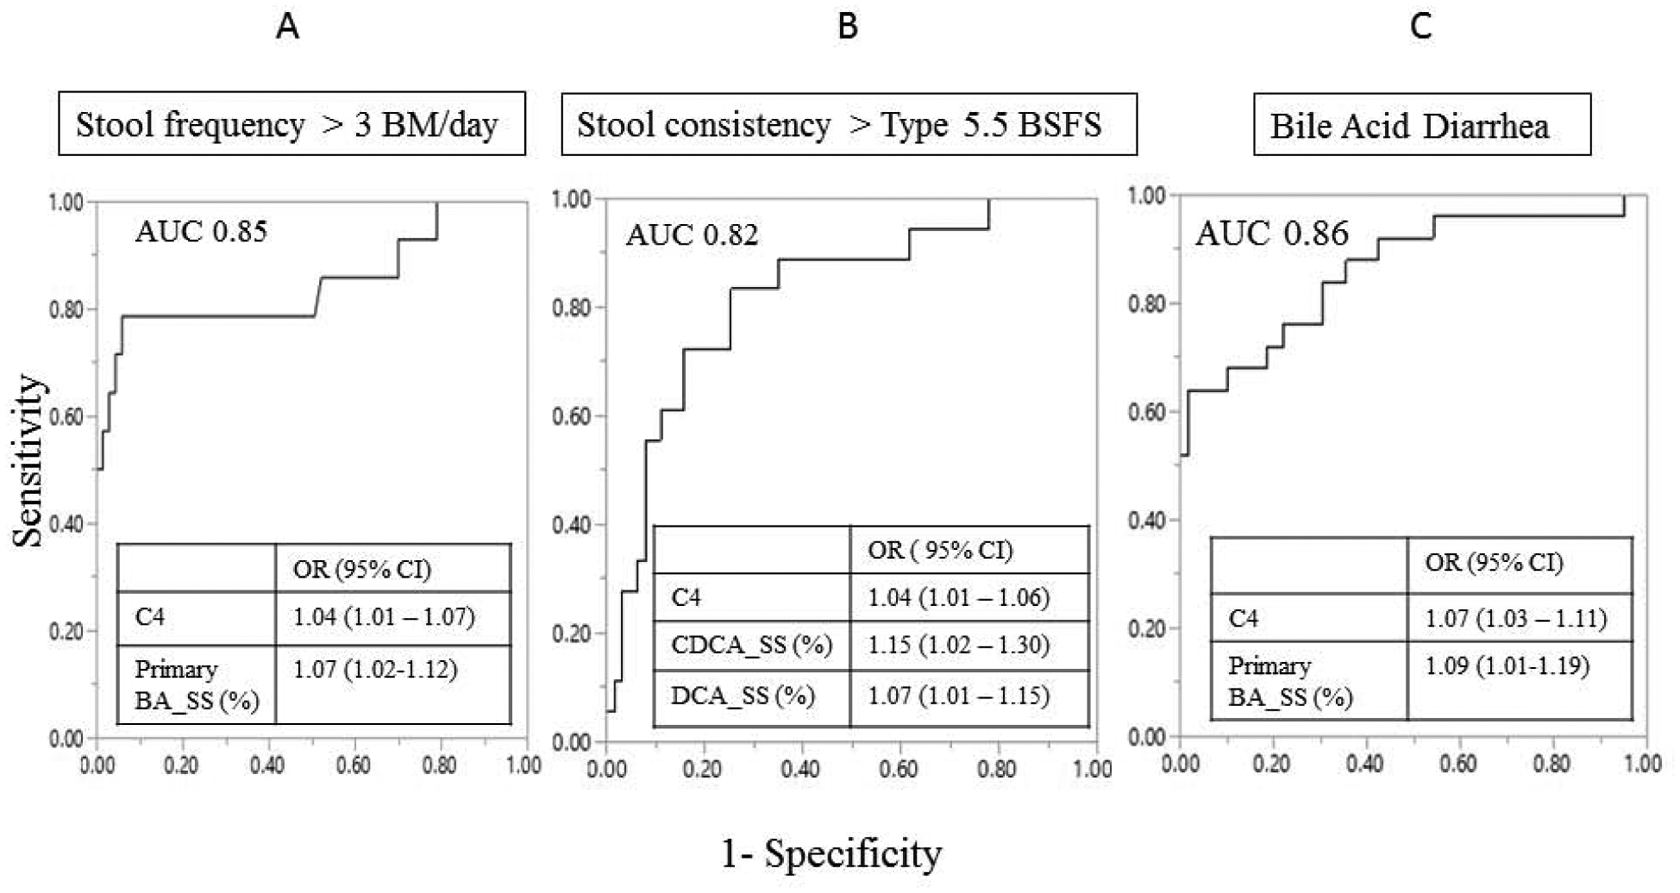
Figure 1. ROC curve and odds ratio (95% CI) of significant predictors of clinical markers of diarrhea based on stool frequency (A), stool consistency (B), and diagnosing bile acid diarrhea (C).

Primary BA-SS=primary bile acid measured from the single stool sample; CDCASS=chenodeoxycholic acid measured from single stool sample; DCA-SS=deoxycholic acid measured from single stool sample; C4=7a-hydroxy-4-cholesten-3-one; BSFS=Bristol Stool Form Scale; ROC=receiver operating characteristic; AUC=area under the curve; OR=odds ratio; CI=confidence interval
