
Figure 6.
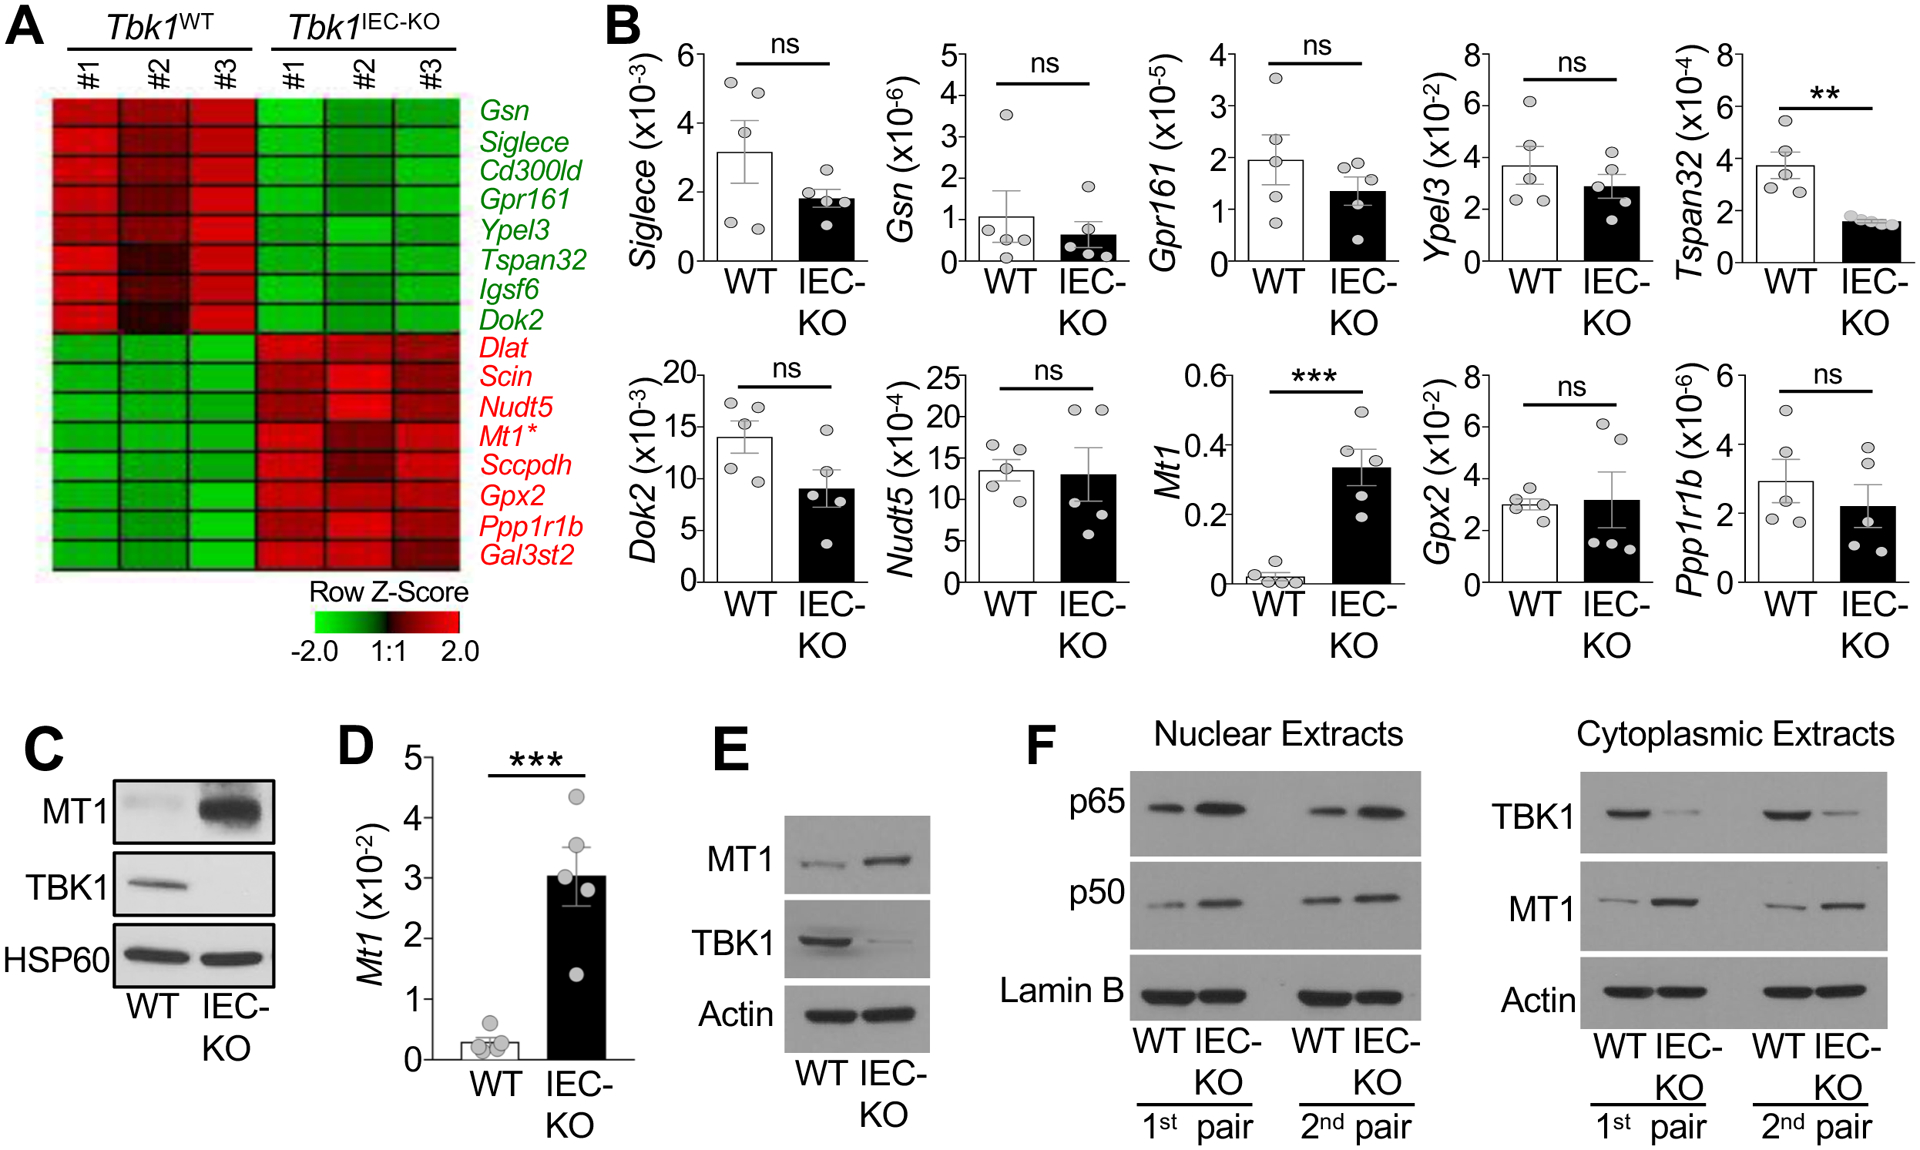
TBK1 controls the expression of Mt1 in IECs. (A) A Heat map of highly variable genes detected in RNA sequencing analysis using primary IECs from Tbk1WT and Tbk1IEC-KO mice (n = 3 each). (B) qRT-PCR analysis of the indicated mRNAs in freshly isolated IECs from Tbk1WT and Tbk1IEC-KO mice (each circle represents a mouse). Data are presented as values relative to Actb. (C) Immunoblot analysis of the indicated proteins in small intestinal IECs of Tbk1WT and Tbk1IEC-KO mice. (D and E) qRT-PCR analysis of Mt1 mRNA expression relative to Actb (D) and immunoblot analysis of MT1 protein expression (E) in freshly isolated IECs derived from the large intestines of Tbk1WT and Tbk1IEC-KO mice. (F) Immunoblot analysis of the indicated proteins in the nuclear or cytoplasmic extracts of freshly isolated small intestine IECs of Tbk1WT and Tbk1IEC-KO mice. Data are representative of 1 (A), or 2 (D-F), or 3 (B and C) independent experiments. Summary data are mean ± s.e.m. with P values being determined by unpaired two-tailed Student’s t-test. **P < 0.01, ***P < 0.001; ns, not significant.