
Figure 6. Tuft cell and Hpgds expression in human pancreatic tumorigenesis.
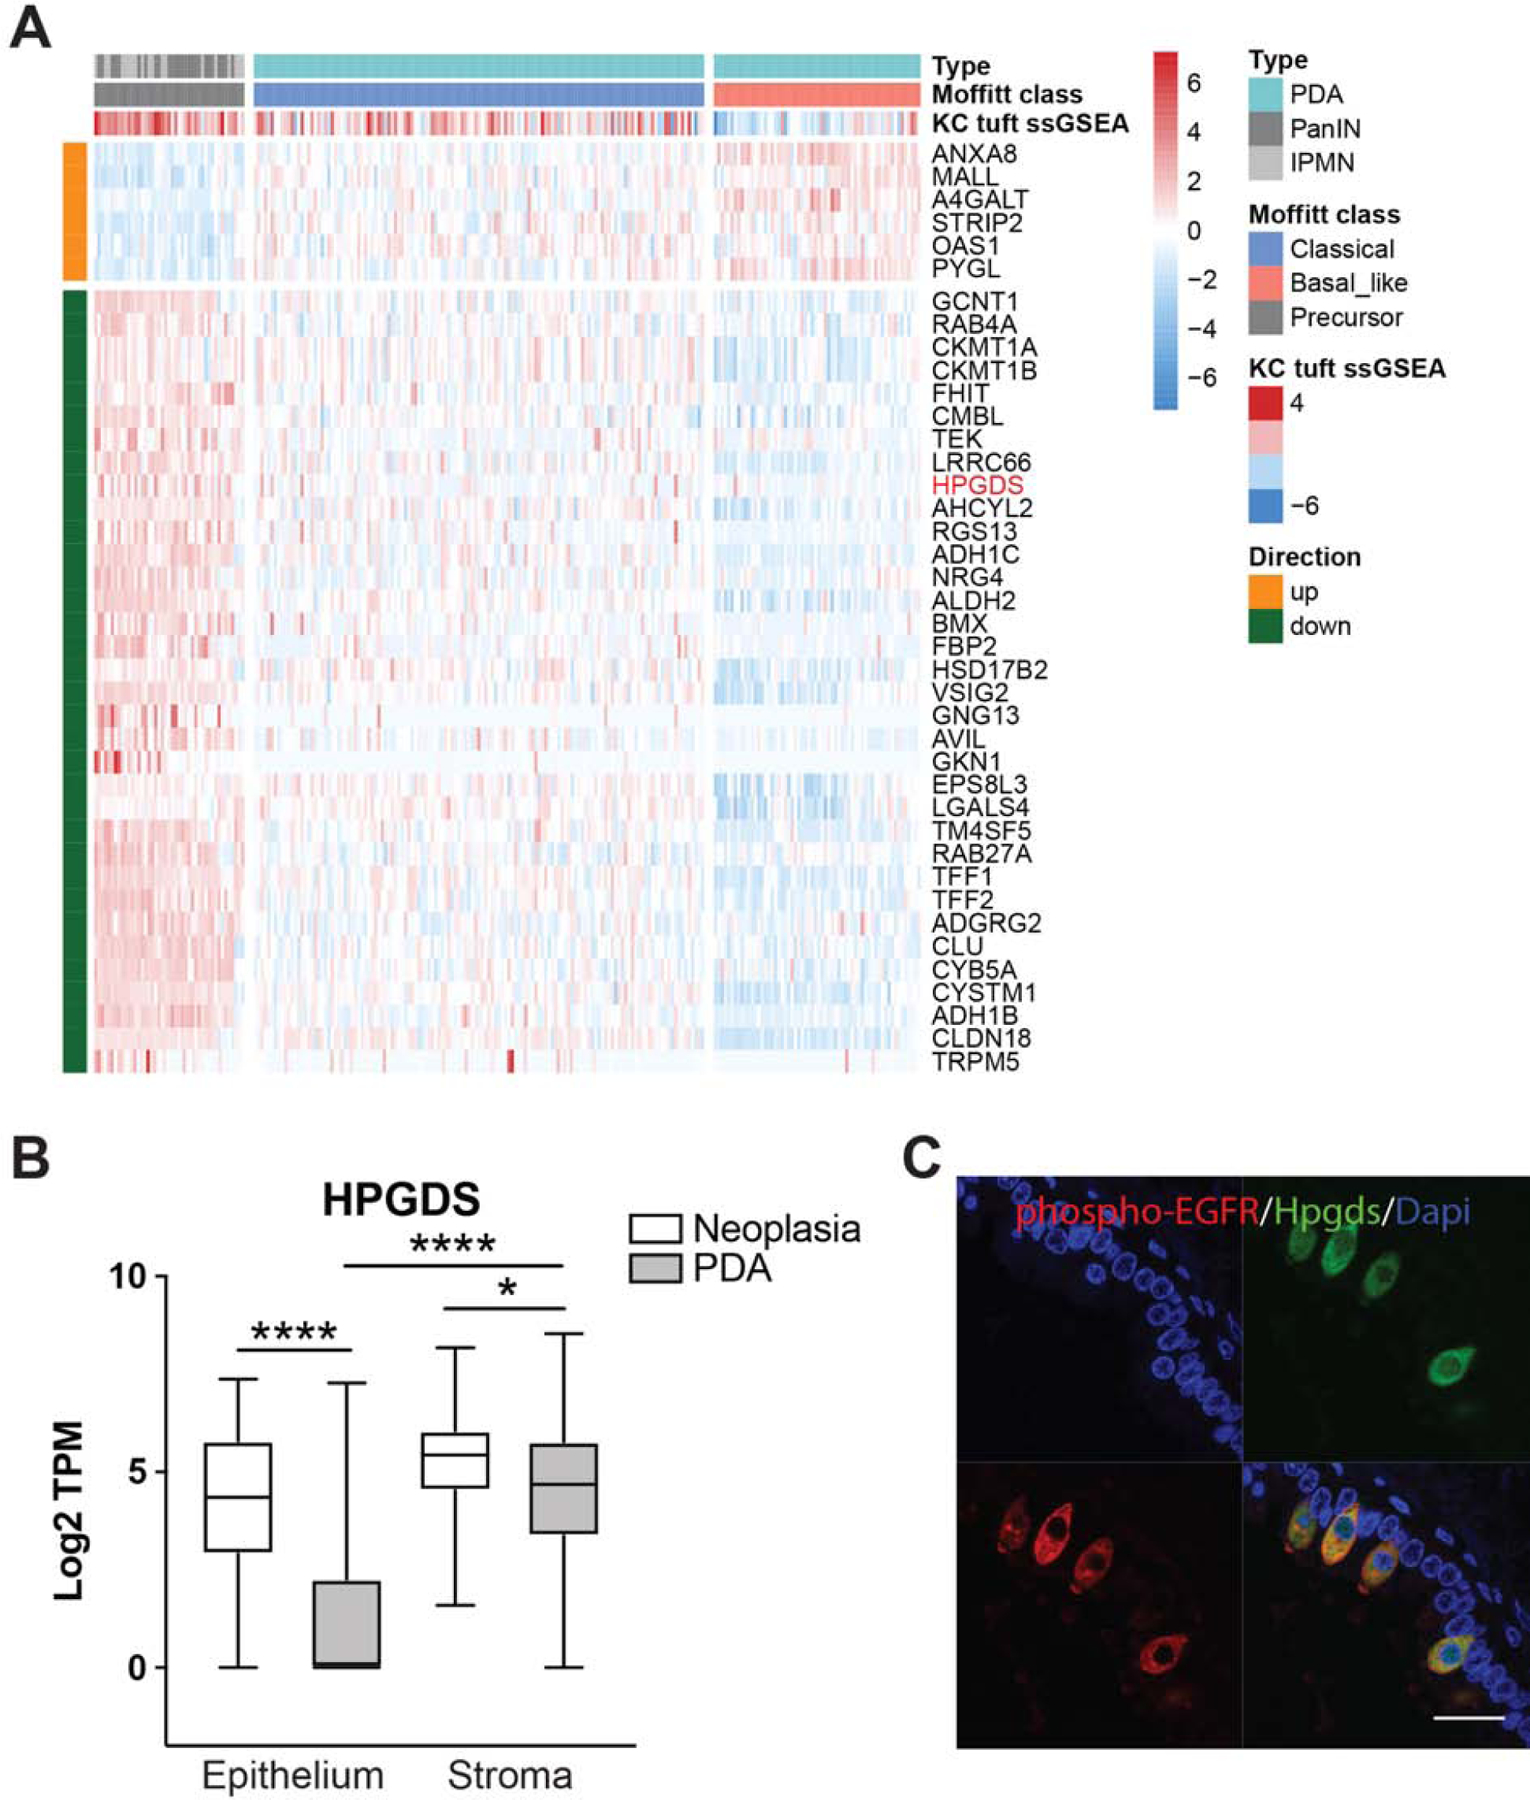
(A) Heat map with hierarchical clustering showing a significant decrease in tuft cell-associated genes between pre-invasive PanIN and IPMN (n = 45) and PDA (n = 197), as well as between classical and basal-like PDA (p<0.01). ssGSEA, single sample gene set enrichment analysis. (B) RNA-seq of Hpgds in matched epithelial and stromal compartments from the same patients. Whiskers, minimum to maximum values (C) Co-immunofluorescence for tuft cell marker phospho-EGFR, red, and Hpgds, green, in human pancreatitis. Scale bar, 20μm.