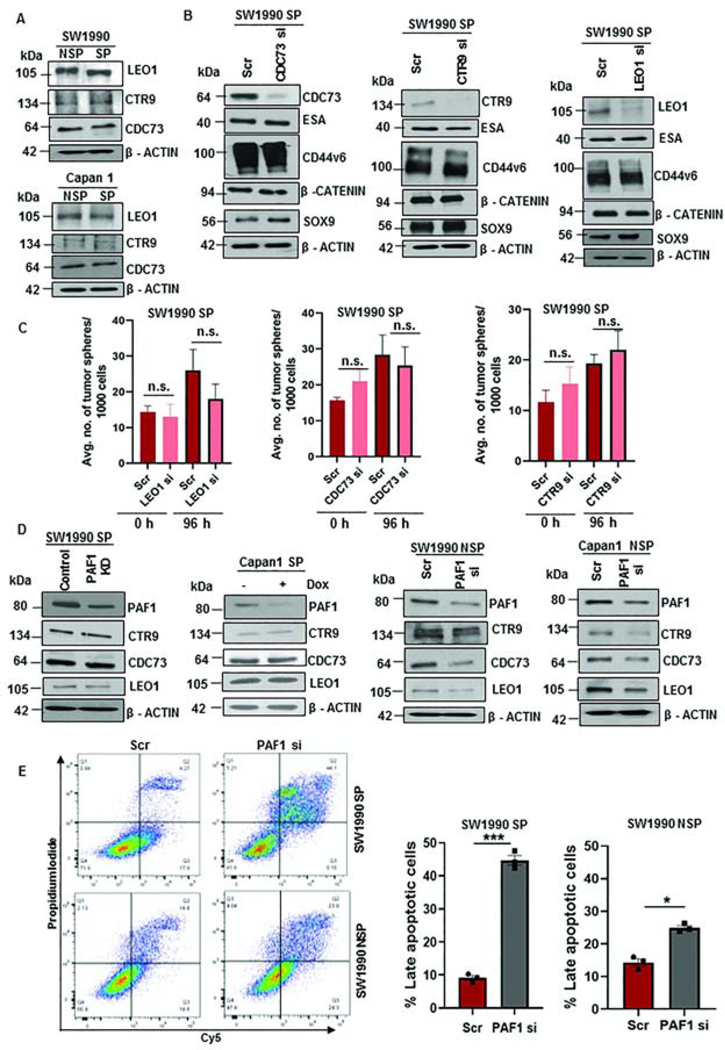
Figure 3: LEO1, CTR9, and CDC73 are not major contributors to CSC maintenance.
A. Immunoblot analysis of PAF1C subunits in SP and NSP cells. Equal amounts of protein were loaded in each well. B. Immunoblot analysis of CSC and self-renewal markers with individual KD of CDC73, CTR9, and LEO1. C. Average number of tumor spheres formed with individual knockdown of LEO1, CDC73, and CTR9 at 0 h and 96 h. Data representative of two independent experiments and three replicates per condition. D. Immunoblot analysis of PAF1C subunits (CTR9, LEO1, and CDC73) with PAF1 depletion in SP and NSP cells. E. Scatter plots demonstrating apoptotic cells following 72 h treatment with Scr or PAF1 si in SW1990 SP and SW1990 NSP cells. Quantification of the percentage of late apoptotic cells is shown on the right. n.s. = non-significant.

