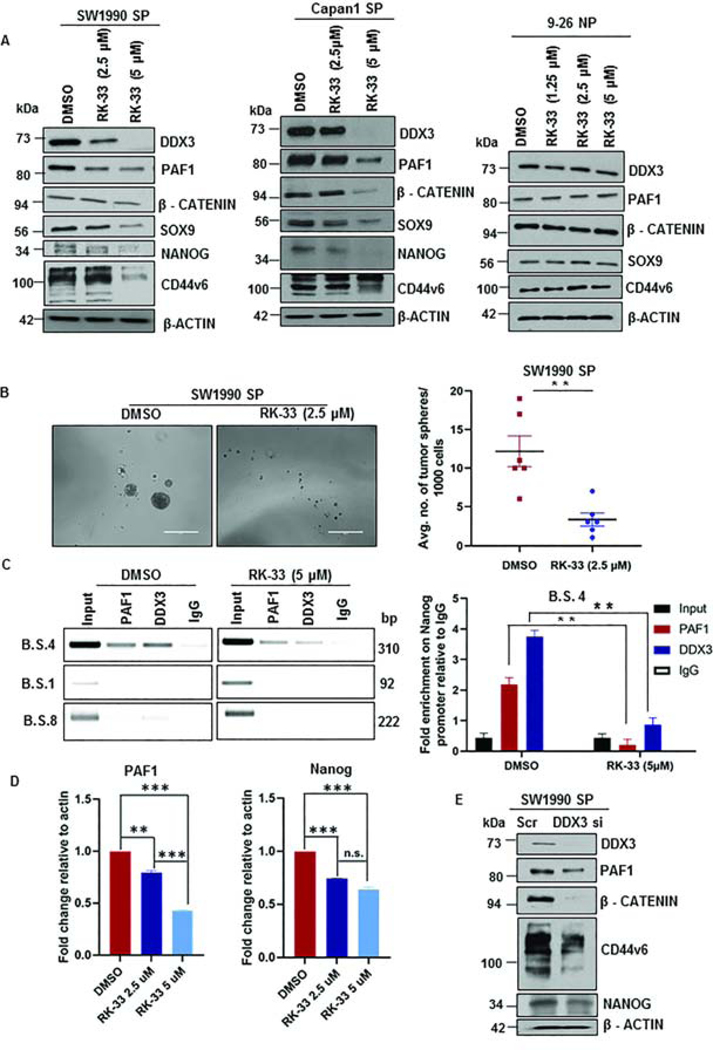
Figure 6: DDX3 inhibition downregulates CSC markers and decreases binding on Nanog promoter.
A. Immunoblotting analysis for DDX3, PAF1, CD44v6, NANOG, SOX9, and β-CATENIN following RK-33 treatment for 48 h. B. Representative images of tumor spheres in control and RK-33 (2.5 μM)-treated SW1990 SP cells. Quantification of the average number of tumor spheres is shown on the right and is represented as mean ± SEM. Data representative of two independent experiments and six replicates per condition. Scale bars are 1000 μm. C. ChIP-PCR gel images for PAF1 and DDX3 using primers specific for B.S. 4, B.S. 1, and B.S. 8 in DMSO- and RK-33 (5 μM)-treated SW1990 SP cells. ChIP qRT PCR analysis of PAF1 and DDX3 using B.S. 4 primers in DMSO- and RK-33 (5 μM)-treated SW1990 SP cells is represented on right. D. Quantification of PAF1 and Nanog transcripts in DMSO- and RK-33-treated CSCs. Error bars indicate SEM values. E. Immunoblotting analysis for DDX3, PAF1, CD44v6, NANOG, and β-CATENIN in control and DDX3 KD CSCs.

