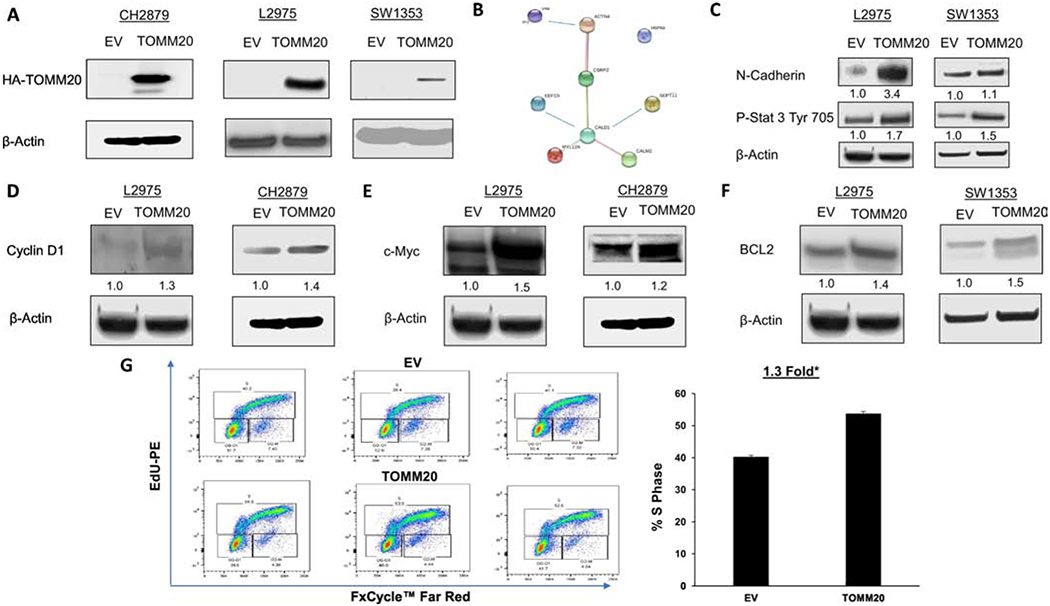
Figure 2. Effect of TOMM20 on markers of cancer aggressiveness.

A, HA-TOMM20 immunoblot in CH2879, L2975, and SW1353 cells with TOMM20 overexpression compared to EV control. In CH2879 cells the two bands represent HA variants. B, The proteins identified from the proteomic analysis was subjected to String v11.0 analysis to identify functional interactions between the deregulated proteins. Each node represents a protein and each edge represents an interaction. C, Phospho-STAT3 tyr705 and N-cadherin immunoblot of EV control and TOMM20 overexpressing L2975 and SW1353 cells. D, Cyclin D1 immunoblot of EV control and TOMM20 overexpressing L2975 and CH2879 cells. E, C-MYC immunoblot of EV control and TOMM20 L2975 and CH2879 overexpressing cells. F, BCL2 immunoblot of EV control and TOMM20 overexpressing L2975 and SW1353 cells. G, Proliferation rates were measured with EdU incorporation and the cell cycle was assessed in carcinoma cells. DNA synthesis was measured with EdU-PE incorporation and ploidy was assessed with FxCycle™ Far Red Stain (N=3). All immunoblots are representative examples,*p<0.05.
