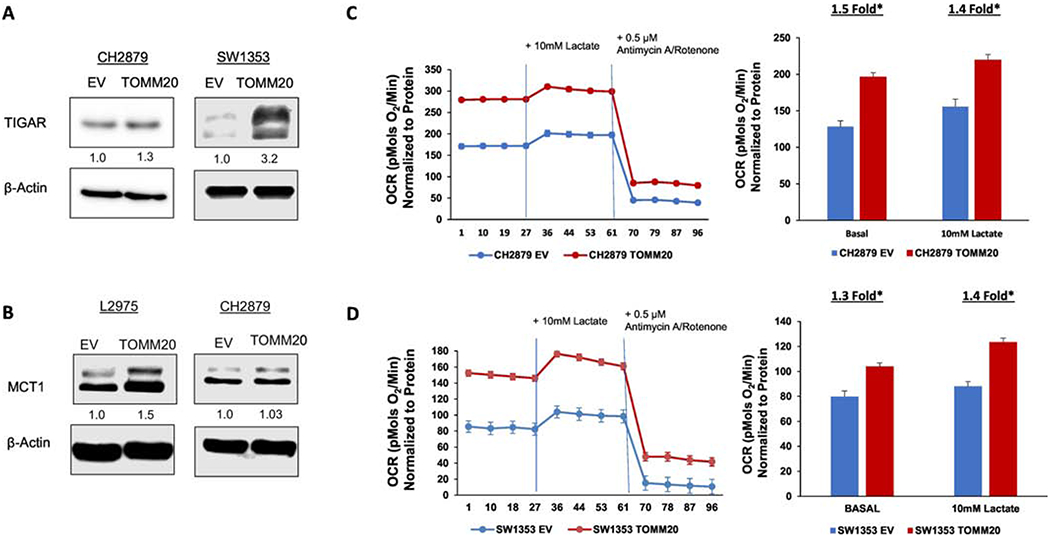
Figure 3. TOMM20 overexpression promotes mitochondrial metabolism.

A, TIGAR immunoblot of EV control and TOMM20 overexpressing CH2879 and SW1353 cells. B, MCT1 immunoblot of EV control and TOMM20 overexpressing L2975 and CH2879 cells. C, Oxygen consumption was measured in EV control (blue) and TOMM20 overexpressing (red) CH2879 cells. Oxygen consumption was measured under baseline conditions with 5mM glucose, after injection of 10mM lactate, and after injection of 0.5μM Antimycin A and Rotenone. OCR values were normalized to protein concentration (N=12). D, Oxygen consumption was measured in EV control (blue) and TOMM20 overexpressing (red) SW1353 cells. Oxygen consumption was measured under baseline conditions with 5mM glucose, after injection of 10mM lactate, and after injection of 0.5μM Antimycin A and Rotenone. OCR values were normalized to protein concentration (N=6). *p<0.05
