
Figure 4. Effect of TOMM20 overexpression on therapy resistance.
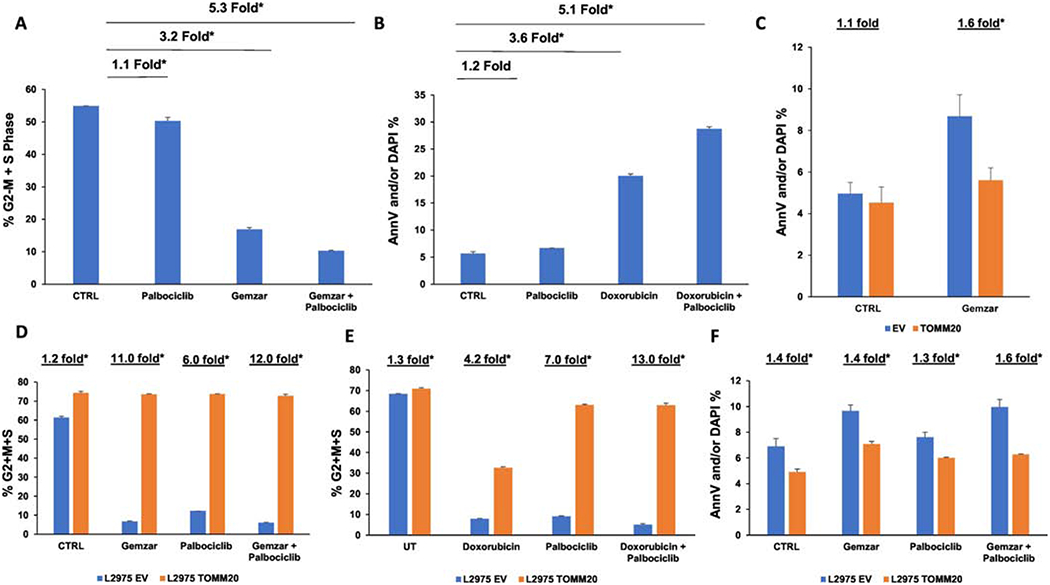
A Proliferation rates were measured with EdU incorporation and the cell cycle was assessed in carcinoma cells. DNA synthesis was measured with EdU-PE incorporation and ploidy was assessed with FxCycle™ Far Red Stain in L2975 chondrosarcoma cells after treatment with 20nM Palbociclib, 50nM Gemcitabine, and the combination of 20nM Palbociclib and 50nM Gemcitabine. B, Apoptosis levels were measured with Annexin-V (AnnV) and DAPI staining after treatment with 2μM Palbociclib, 2μM Doxorubicin, and the combination of 2μM Palbociclib and 2μM Doxorubicin. The percentage of apoptotic or dead L2975 cells (Annv-V-positive and/or DAPI positive) is shown. C, Apoptosis levels were measured in EV control and TOMM20 overexpressing L2975 cells after treatment with 5μM Gemcitabine (Gemzar). D, Proliferation rates were measured with EdU incorporation and the cell cycle was assessed in carcinoma cells. DNA synthesis was measured with EdU-PE incorporation and ploidy was assessed with FxCycle™ Far Red Stain in L2975 control and TOMM20 overexpressing cells after treatment with 0.5μM Palbociclib, 10μM Gemcitabine (Gemzar), and the combination of 0.5μM Palbociclib and 10μM Gemcitabine (Gemzar). E, Proliferation rates were measured with EdU incorporation and the cell cycle was assessed in carcinoma cells. DNA synthesis was measured with EdU-PE incorporation and ploidy was assessed with FxCycle™ Far Red Stainin L2975 control and TOMM20 overexpressing cells after treatment with 1μM Palbociclib, 1μM Doxorubicin, and the combination of 1μM Palbociclib and 1μM Doxorubicin. F, Apoptosis levels were measured with Annexin-V (AnnV) and DAPI staining after treatment with 2μM Palbociclib, 10μM Gemcitabine, and the combination of 2μM Palbociclib and 10μM Gemcitabine. The percentage of apoptotic or dead L2975 cells (Annv-V-positive and/or DAPI positive) is shown. N= 3-4, *p<0.05