
Figure 6. Expression of mitochondrial markers in murine tumors.
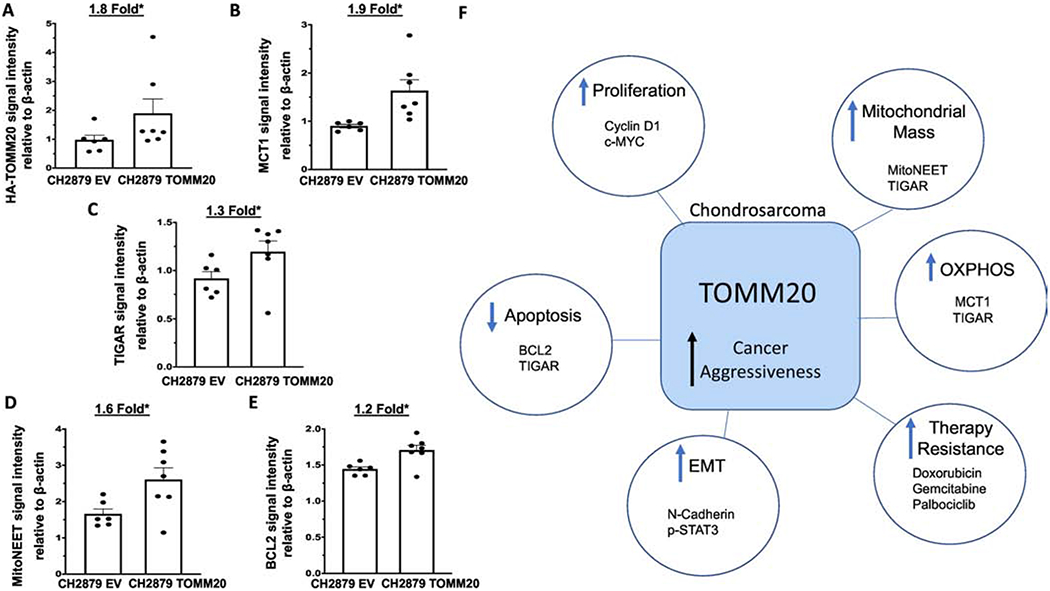
A, Quantification of TOMM20 protein levels normalized to β-actin control of tumors generated from EV control and TOMM20 overexpression. B, Quantification of MCT1 protein levels normalized to β-actin of tumors generated from control and EV TOMM20 overexpression. C, Quantification of TIGAR protein levels normalized to β-actin of tumors generated from EV control and TOMM20 overexpression. D, Quantification of mitoNEET protein levels normalized to β-actin of tumors generated from EV control and TOMM20 overexpression. E, Quantification of BCL2 protein levels normalized to β-actin of tumors generated from EV control and TOMM20 overexpression. F, Study schematic displaying the results of this study which include TOMM20 overexpression induces a more aggressive phenotype by increasing the expression of proteins involved in invasion and metastasis, proliferation, and resistance to apoptosis, promoting mitochondrial metabolism, and therapy resistance. EV control N=6, TOMM20 N=7, *p<0.05