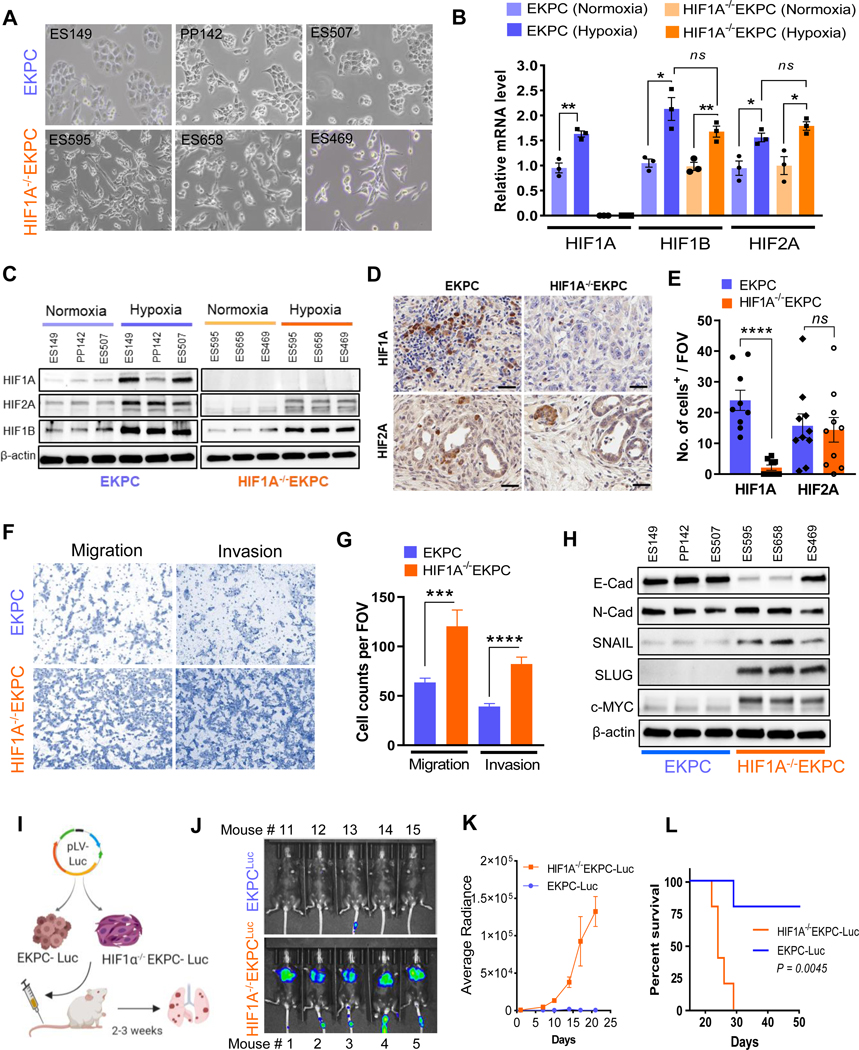
Figure 2: Depletion of HIF1A enhances invasion and migration of Pancreatic Cancer cells.
(A) Bright field image of primary cell lines derived from EKPC (ES149, PP142 & ES507) and HIF1A−/− EKPC (ES595, ES658 & ES469) tumors. (B) Expression of HIF1A, HIF1B, and HIF2A mRNA under hypoxic/normoxic conditions in EKPC and HIF1A−/−EKPC cell lines. Relative gene expression level for HIF1A, HIF1B, and HIF2A in EKPC (blue) and HIF1A−/− EKPC (orange) cells were normalized with GAPDH expression; n=3 biologically independent experiments; *P<0.05 and **P<0.005 by unpaired t test. (C) Western blot analysis of HIF1A, HIF2A and HIF1B under hypoxic/normoxic conditions in EKPC and HIF1A−/−EKPC cell lines. Beta-actin was used as loading control. (D) Representative images of immunohistochemistry staining for HIF1A and HIF2A in EKPC and HIF1A−/−EKPC tumor sections. Scale bar, 50 μm (E) Quantification of HIF1A and HIF2A positive cells per field of vision in EKPC and HIF1A−/−EKPC tumor sections. The data are shown as the mean ± s.e.m. P values by unpaired t test. ns, not significant, ****P < 0.0001. (F&G) Representative images and quantitative analysis of transwell migration and matrigel invasion assay of EKPC and HIF1A−/−EKPC cells. Total number of cells per field were counted. n=3 biologically independent experiments ***P < 0.001, ****P < 0.0001 by t test. (H) Immunoblot analysis of EMT markers (E-cad, Snail and Slug) and c-Myc protein in EKPC and HIF1A−/−EKPC cells. (I) Schematics of in vivo lung colonization assay for metastatic burden. EKPC and HIF1A-/EKPC cells expressing Luciferase were injected into the lateral tail vein of immunocompetent C57BL/6 mice (n=5 for each group), and (J&K) Representative bioluminescence imaging and quantitative analysis of lung metastasis by BLI plot **p<0.001 by Mann Whitney test. (L) KaplanMeier analysis of mice injected with EKPC and HIF1A−/−EKPC cells. **p< 0.005 by Log-rank (Mantel–Cox) test.

