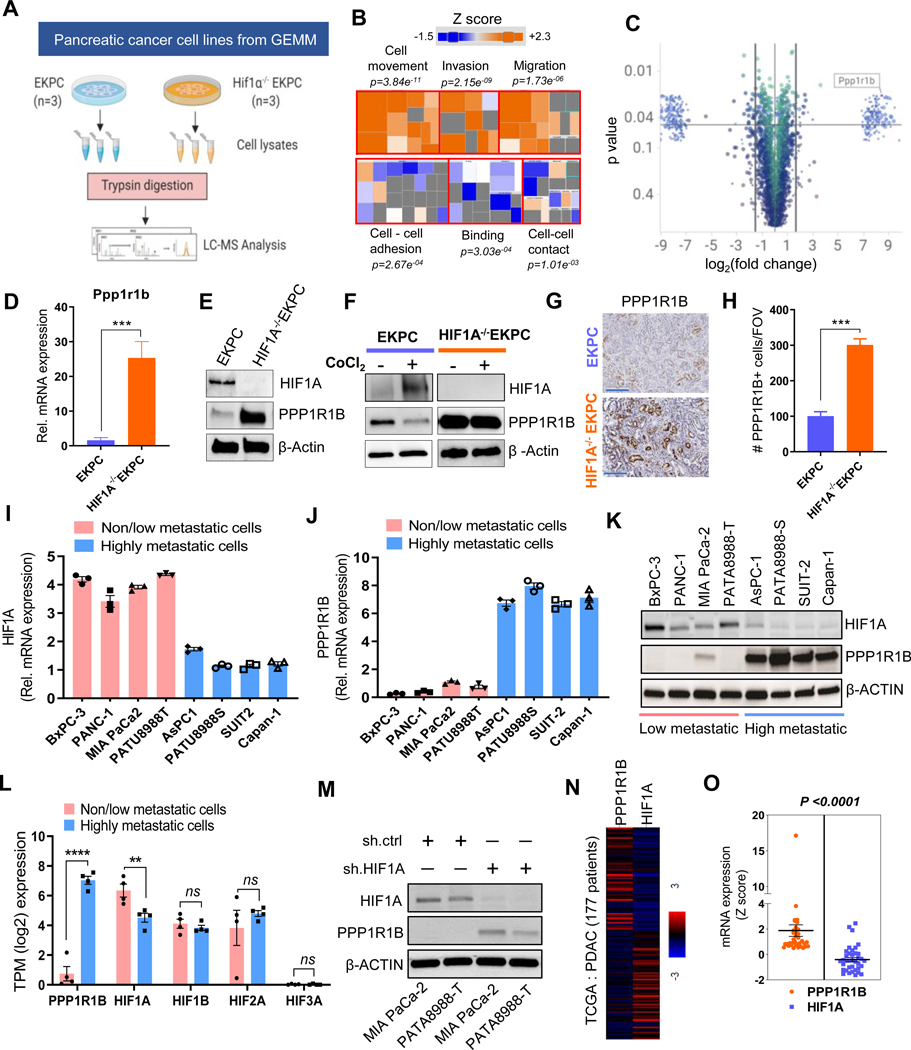
Figure 3: HIF1A regulates PPP1R1B in pancreatic cancer.
(A) Schematic workflow of proteomics analysis of EKPC and HIF1A−/−EKPC cells (B) The Disease and Function heatmap generated by IPA of the proteomics data reflecting the significantly enhanced (orange) or decreased (blue) cellular functions in HIF1A−/−EKPC compared with the EKPC cells. The positive and negative z scores are indicated by orange and blue color respectively. The size of the boxes reflects the predicted direction of change for the function. p values are calculated by Fisher’s Exact Test (C) Scatter plot depicting the differentially expressed proteins (DEP) in HIF1A−/−EKPC cells compared with the EKPC cells. Proteins were organized by log2 fold change (x-axis) and p-value (y-axis). The cutoff lines (pvalue of 0.05 and log2 fold change ±1.5) are shown in black. PPP1R1B protein is marked exhibiting 8.426 log2fold change; p=0.016. (D) qPCR analysis showing Ppp1r1b mRNA levels in EKPC (blue) and HIF1A−/−EKPC (orange) cells. Gapdh was used as control. ***p < 0.001 by t test analysis. (E) Immunoblot analysis of HIF1A, Ppp1r1b in EKPC and HIF1A−/−EKPC cells. (F) Western blot analysis of HIF1A and PPP1R1B expression in untreated and CoCl2 treated (100 μM for 12 hr) EKPC and HIF1A−/−EKPC cells. (G,H) IHC staining and quantification for PPP1R1B+ cells in EKPC and HIF1A−/−EKPC tumors, Scale:200 μm, (n = 5 for each group, n = 3 field of vision). ***p < 0.001 by t test analysis. (I-J) q-PCR analysis of HIF1A and PPPP1R1B transcripts in non/low-metastatic (BxPC-3, PANC-1, Mia PACA-2 and PATU8988T) and high-metastatic (AsPC-1, PATU8988S, SUIT-2 and Capan-1) human pancreatic cancer cell lines. ****p < 0.0001 by ordinary one-way ANOVA (K) Immunoblot analysis of HIF1A and PPPP1R1B in non/low-metastatic and high-metastatic human pancreatic cancer cell lines (L) Comparative expression analysis of PPP1R1B, HIF1A, HIF1B, HIF2A and HIF3A between non/low-metastatic (BxPC-3, PANC-1, Mia PACA-2 and PATU8988T) and high-metastatic (AsPC-1, PATU8988S, SUIT-2 and Capan-1) human pancreatic cancer cell lines. ns, not significant **p < 0.005, ****p < 0.0001 by unpaired t test analysis. (M) Western blot analysis of PPP1R1B and HIF1A of MIA-PaCa-2 and PATU8988T cells transfected with sh.Ctrl and sh.HIF1A (N) Heat map of HIF1A and PPP1R1B expression in PDAC patients from TCGA. (O) Paired analysis of PPP1R1B and HIF1A expression in PDAC patients (n=36) ranked based on Z scores (≥0.5). ****p<0.0001 by paired t test. All experiments were carried out in triplicate. All bar graphs represent mean and error bars are s.e.m.

