Fig. 1.


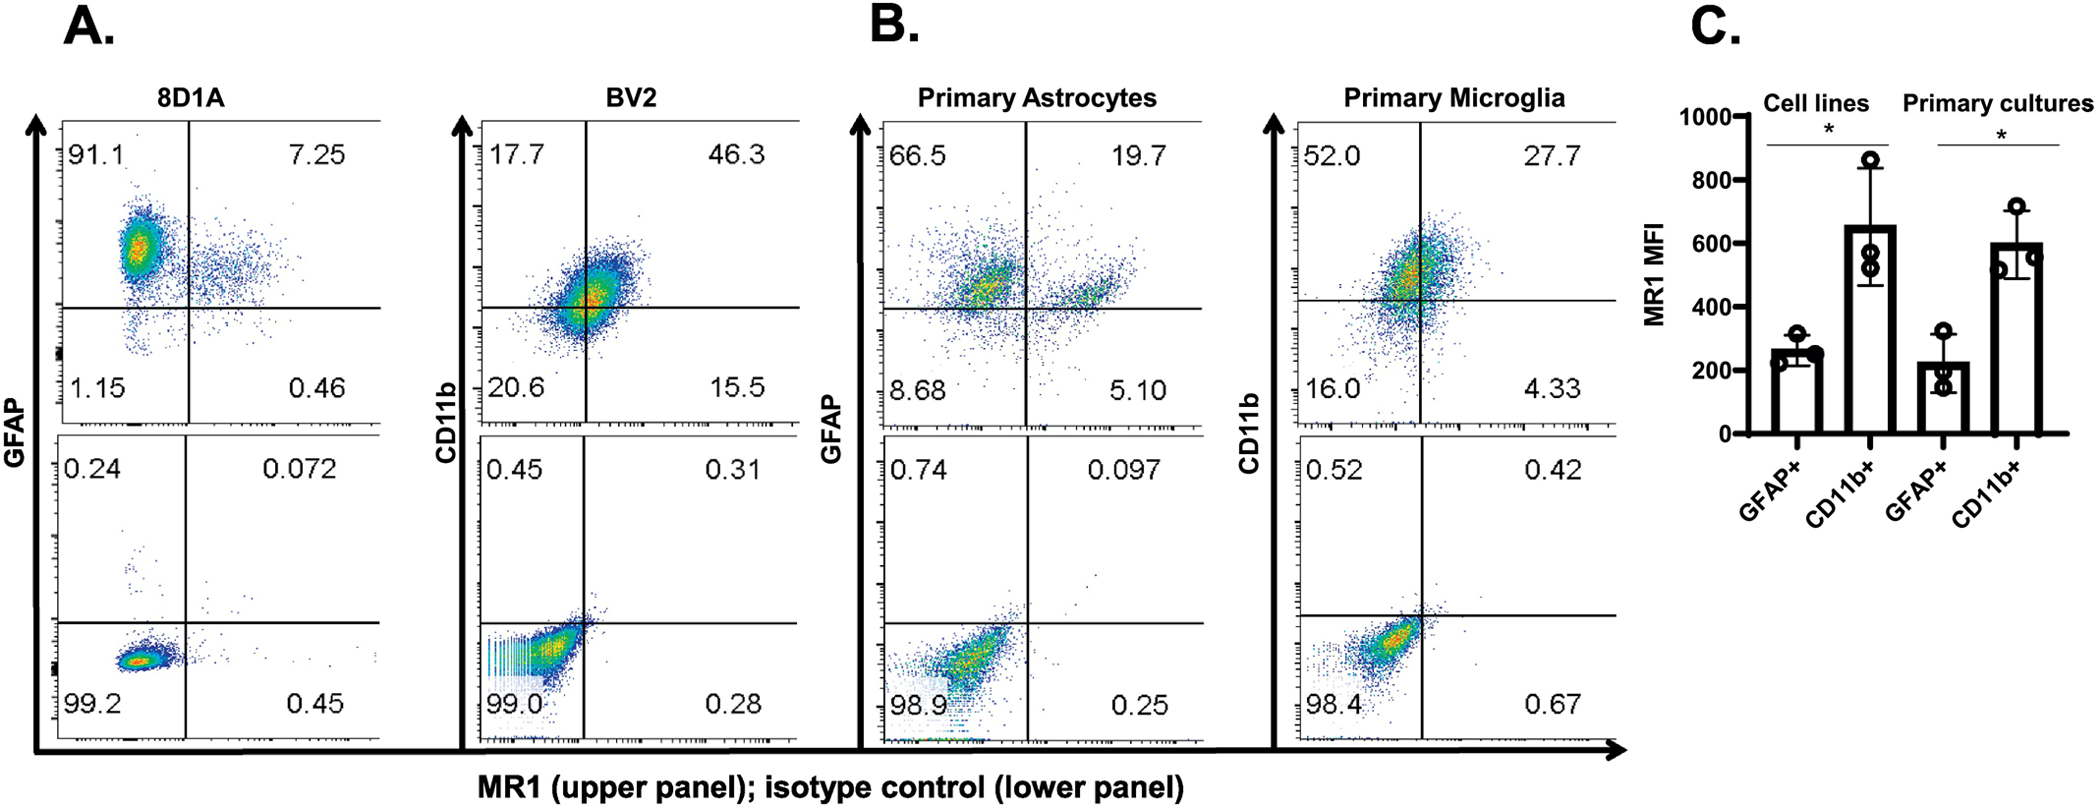
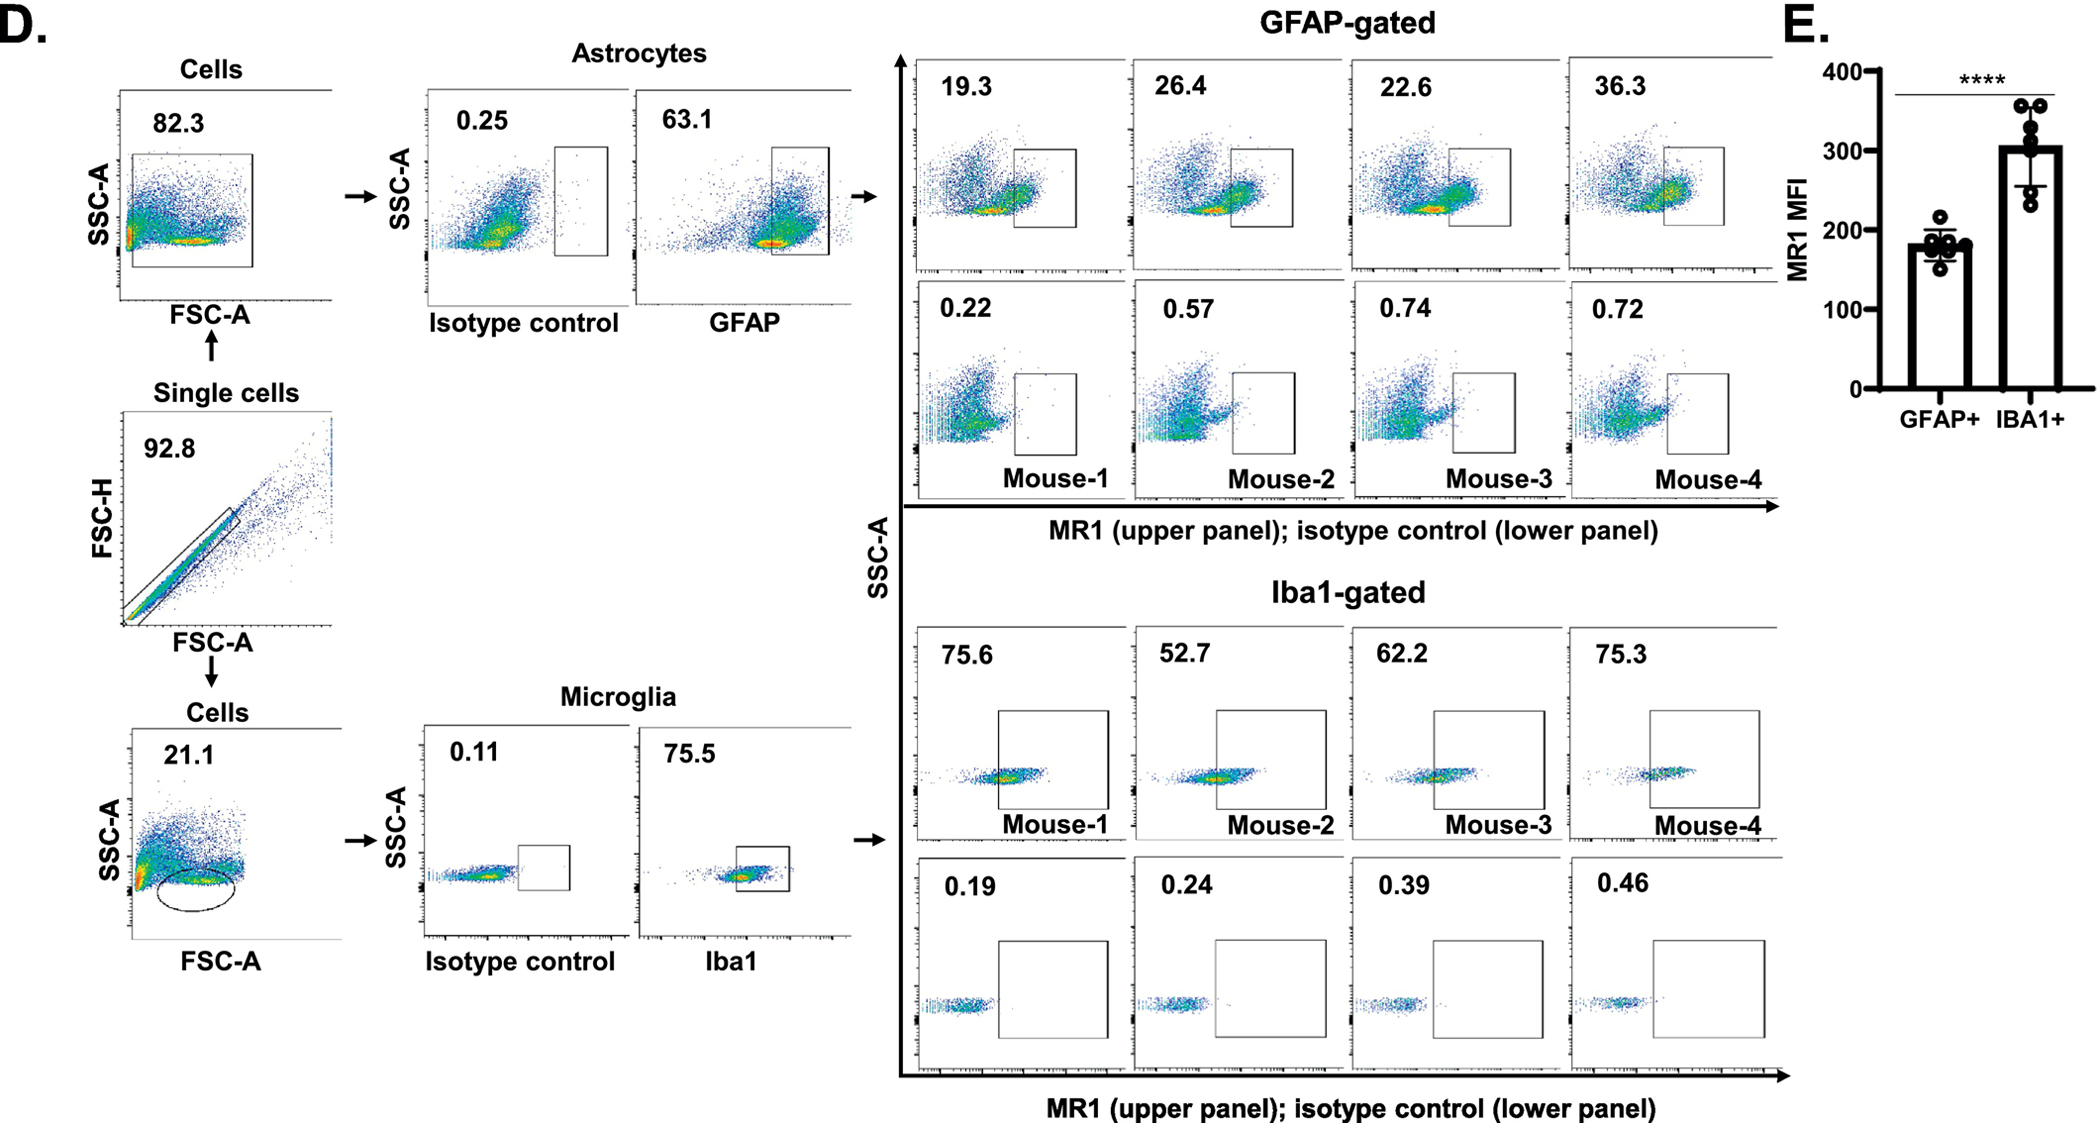
Analysis of MR1 surface expression by mouse brain astrocytes and microglia. A & B. An astrocyte cell line (8D1A), microglia cell line (BV2) and, primary astrocytes and primary microglia were double-stained using APC-labeled anti-MR1 and FITC-labeled anti-GFAP/CD11b mAbs and analyzed by flow cytometry. The percent of MR1+ cells is indicated in the upper panel of each quadrant, whereas the lower panel shows the isotype control for each group. A representative dot plot of one of the three experiments performed is shown. C. The MFI of MR1 in the GFAP+ and CD11b+ cells is shown and the data are presented as the mean ± SD from three independent experiments. D. Brain single cell suspensions from mice were double-stained with APC-labeled anti-MR1 and FITC-labeled anti-GFAP/anti-Iba1 mAbs and analyzed by flow cytometry. The GFAP+ and Iba1+ cells were first gated (the percentage of cells in the gate is indicated) and the percent of MR1+ cells was then analyzed in the population of GFAP+ and Iba1+ cells. The percent of MR1+ cells in GFAP+ and Iba1+ gated cells is indicated for each individual mouse (N=4) in the top row of the upper and lower panels, respectively, whereas the bottom row in both shows the isotype control for each group. The results show data from a representative experiment of two performed. E. MFI of MR1 in brain GFAP+ and Iba1+ cells are shown. The symbols represent individual mice and the data are shown for all analyzed mice (N=7) from two independent experiments. The data are shown as the mean ± SD. *, p<0.05, ****, p<0.0001, by an unpaired Student’s t-test.
