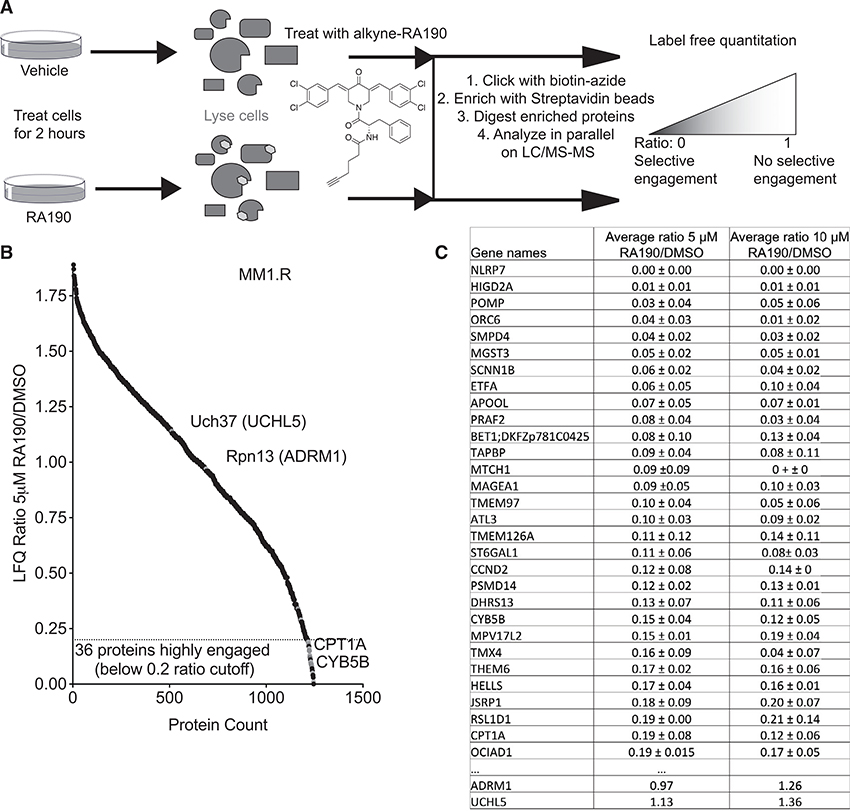
Figure 5. MS-Based Analysis of RA190-Protein Interactions in MM1.R Cells.
(A) Schematic of the label-free quantitative proteomic workflow. See text for details.
(B) Label-free quantitation (LFQ) ratios of proteins from cells treated with 5 μM RA190 or DMSO.
(C) Table of proteins found to be most highly engaged by RA190 and the LFQ ratios of the signals in the RA190- and DMSO-treated samples (a low ratio represents a high level of interaction with RA190 in cellulo). Biological triplicates were analyzed in experimental duplicate, as indicated by standard deviations (represented as ±). Stringency filters were applied to remove potential false positive results. Proteins in green indicate the targets are within the 0.5 cutoff for positive hit identification.

