
Fig. 1.
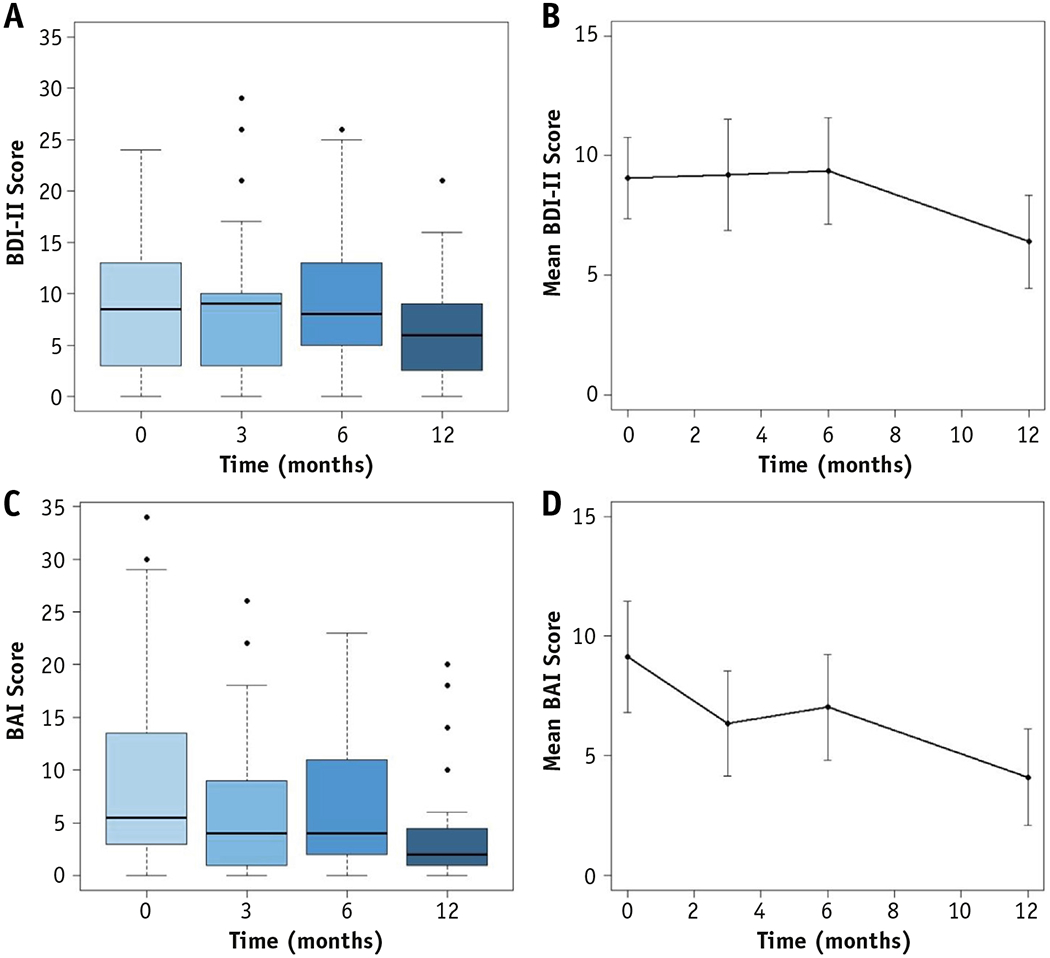
BDI and BAI scores over time. Boxplots and line plots for raw BDI and BAI scores over time. Line plots are mean scores over time with error bars representing the 95% confidence intervals. (a and b) BDI scores are not statistically different over time. (c and d) BAI scores significantly decrease over time (P = .003).