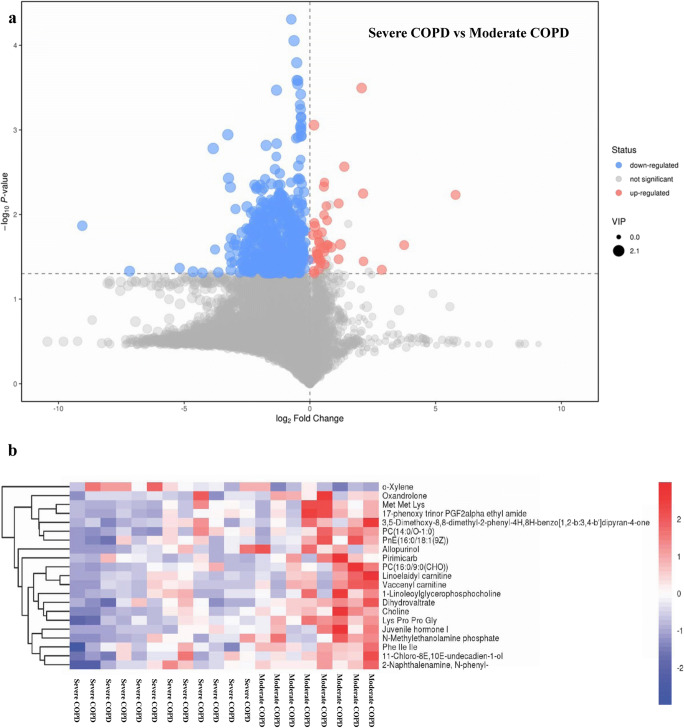
Fig. 3.
Identification of the differential metabolomics profiles of induced sputum between moderate and severe COPD based on a volcano plot and hierarchical clustering analysis. a Volcano plot. The downregulated and upregulated metabolites in severe compared with moderate COPD are marked in blue and red, respectively. X-axis: log2 fold change of metabolites; Y-axis: fold change of –log10 P value determined by Student’s t test. The dot size represents the variable importance in the projection (VIP) value. b Heatmap of the hierarchical clustering analysis. Twenty-one MS2 differential metabolites are presented

