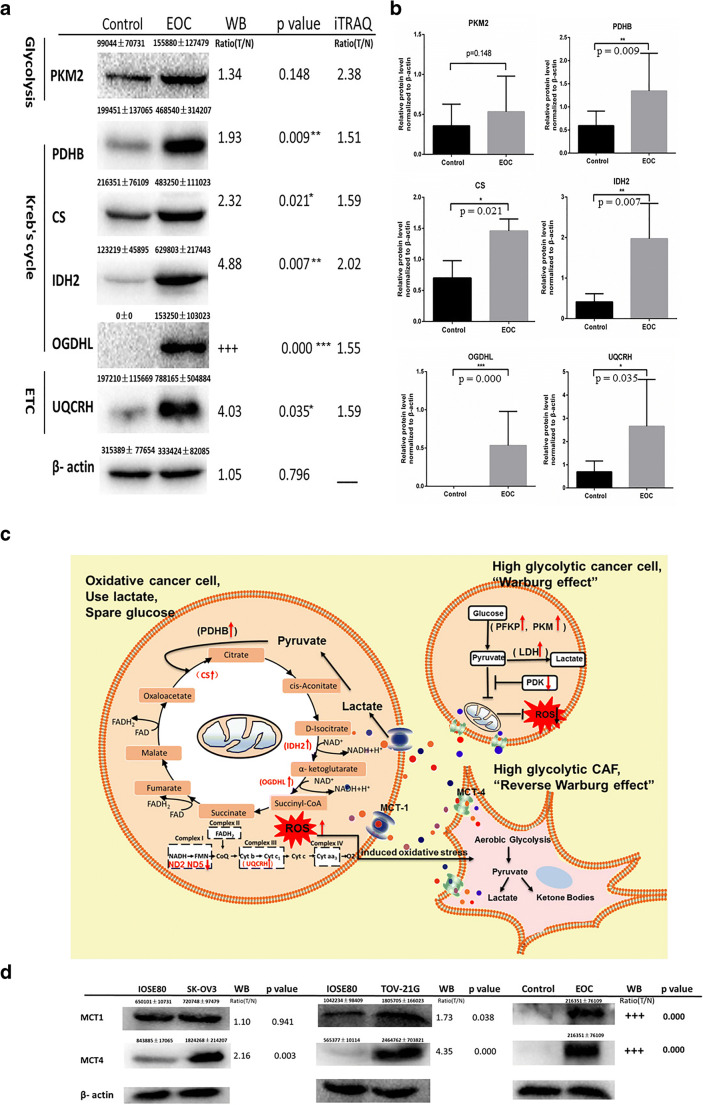
Fig. 5.
Western blot analysis to validate results of iTRAQ labeling. a, b Mitochondrial proteins of EOC and control tissues were analyzed by WB using antibodies against PKM2, PDHB, CS, IDH2, OGDHL, and UQCRH. The levels of PKM2, PDHB, CS, IDH2, OGDHL, and UQCRH were normalized relative to β-actin. Data represent mean values ± SD. c Warburg effect and the reverse Warburg effect. Parenchymal cells showed metabolic heterogeneity. Some cancer cells were high glycolytic cancer cell consisting with “Warburg effect,” and the other cancer cells were oxidative cancer cell consisting with “the reverse Warburg effect.” Tumor cells and stroma cells (especially CAFs) have metabolic symbiosis; thus, cancer cell induced oxidative stress of CAFs by secreting ROS and enhanced aerobic glycolysis in CAFs. In turn, CAFs produced lots of nourishment, which was “eaten” up by the cancer cells to produce ATP. *p < 0.05, **p < 0.01, ***p < 0.001. iTRAQ, isobaric tags for relative and absolute quantitation; EOC, epithelial ovarian carcinoma; WB, western blot; ROS, reactive oxygen species; PKM2, pyruvate kinase M2; PDHB, pyruvate dehydrogenase E1 subunit beta; CS, citrate synthase; IDH2, isocitrate dehydrogenase (NADP(+)) 2; OGDHL, oxoglutarate dehydrogenase L; UQCRH, ubiquinol-cytochrome c reductase hinge protein; CAFs, cancer-associated fibroblasts; PDK, pyruvate dehydrogenase (acetyl-transferring)] kinase; MCT1, solute carrier family 16 member 1; MCT4, solute carrier family 16 member 4

