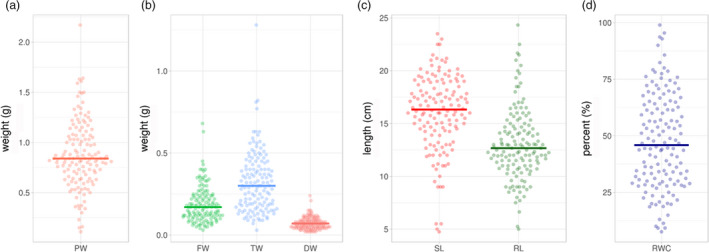
Figure 1.

Phenotypic distribution of drought‐responsive traits in 137 diverse accessions of pigeonpea. The subset was phenotyped for plant weight, fresh weight, turgid weight, dry weight and relative water content under drought stress. The violin plots show the phenotypic distribution of the 137 accessions of the pigeonpea reference set for the targeted traits. The shape of the distribution (skinny on each end and wide in the middle) indicates that the trait distribution is highly concentrated around the median except for dry weight (DW). SL—shoot length; RL—root length; FW—fresh weight; DW—dry weight; TW—turgid weight; RWC—relative water content
