
Figure 3.
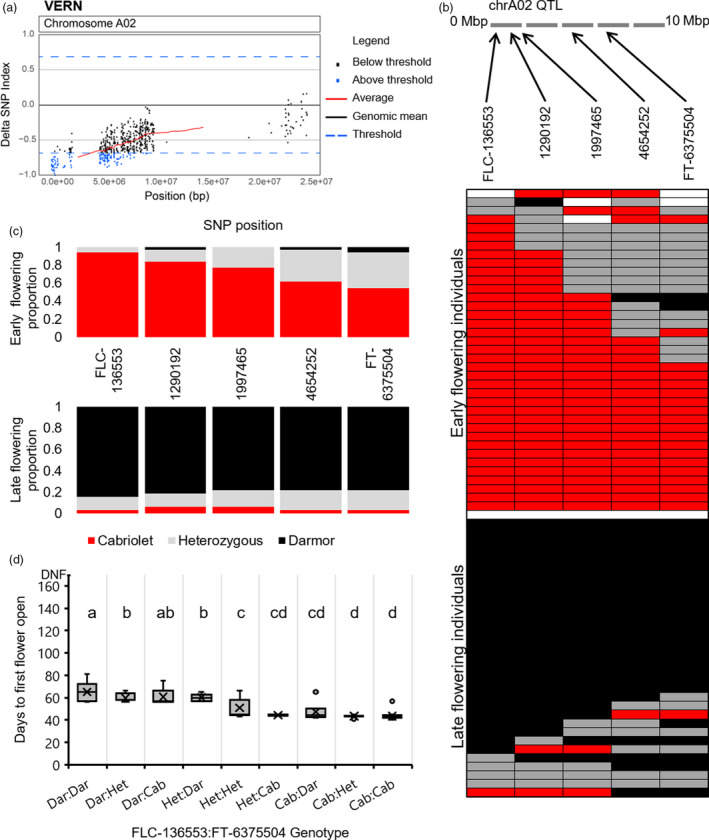
A VERN QTL for flowering time is located on chromosome A02. (a) ΔSNP index plot of chromosome A02 under VERN treatment. ΔSNP index values are plotted in Brassica chromosome A02 order, and values found within the top 1% of ΔSNP index values are coloured blue. (b) Validation of the VERN QTL region on chromosome A02 by KASP assay. Upper panel: schematic of the QTL region on chromosome A02 with the relative locations of SNPs targeted by KASP assay are highlighted. Lower panel: the genotype of all F2 lines within the VERN DNA bulks screened at five SNP positions within the QTL; SNPs homozygous for the Cabriolet allele are coloured red, SNPs homozygous for the Darmor allele are coloured black, SNPs that are heterozygous are coloured grey, and SNP genotypes that could be not determined are left white. The grid is divided into early flowering bulk and the late flowering bulk. (c) The proportion of F2 lines that were homozygous for Cabriolet alleles (red), homozygous for Darmor alleles (black) or heterozygous (grey) at five SNP positions on chromosome A02 in the DNA bulks under VERN treatment. (d) The flowering time phenotype under VERN treatment of F2 lines genotyped for SNP markers FLC‐136553 and FT‐6375504 (Cab = Cabriolet, Dar = Darmor, Het = heterozygous). Letters above the columns indicate significant differences determined by multiple pairwise comparisons using Mann–Whitney U‐test‐with an α‐value of 0.05. Flowering time was recorded as days to first flower open from the first day plants were transferred to the poly‐tunnel.