
Figure 6.
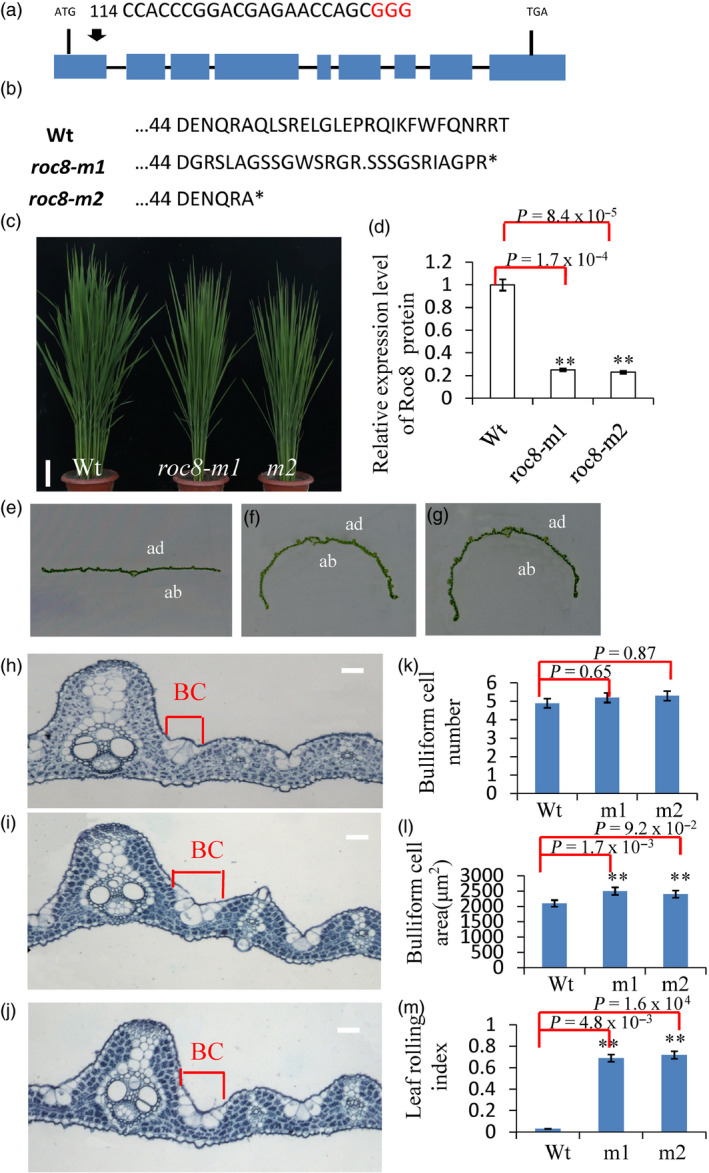
CRISPR/Cas9‐induced mutations in Roc8. (a) Schematic map of the genomic region of Roc8 and the sgRNA target site; arrow shows the sgRNA target site on the Roc8 genomic sequence; the PAM motif (NGG) is shown in red. Blue boxes represent Roc8 exons, and the black lines indicate intron sequences. (b) Amino acid alignment surrounding the sgRNA target region showing the predicted peptide sequence of wild‐type and mutant alleles. The site of the predicted frame‐shifted sequence is underlined, and new stop codons are shown by asterisks. (c) The phenotype of Wt, roc8‐m1 and roc8‐m2 homozygous mutants at the tillering stage (bar = 5 cm). (d) Quantitative PCR analysis showing Roc8 expression levels in Wt, roc8‐m1 and roc8‐m2 homozygous mutant plants. Actin was selected as an internal reference. (e‐g) Leaf phenotypes of (e) Wt, (f) roc8‐m1 and (g) roc8‐m2 homozygous mutants at maturity (ab: abaxial side; ad: adaxial side). (h‐j) Mature leaf showing the extent of bulliform cell area between a major and minor vein in (h) Wt, roc8‐m1 (i) and roc8‐m2 (j) homozygous mutants (bar = 20 μm). (k‐m) Bulliform cell characteristics in Wt and mutant plants, including (k) cell number, (l) area and (m) leaf rolling index (n = 10). Bars represent the SD of measurements. Student’s t‐test was performed to determine significance: ** represents P < 0.01.