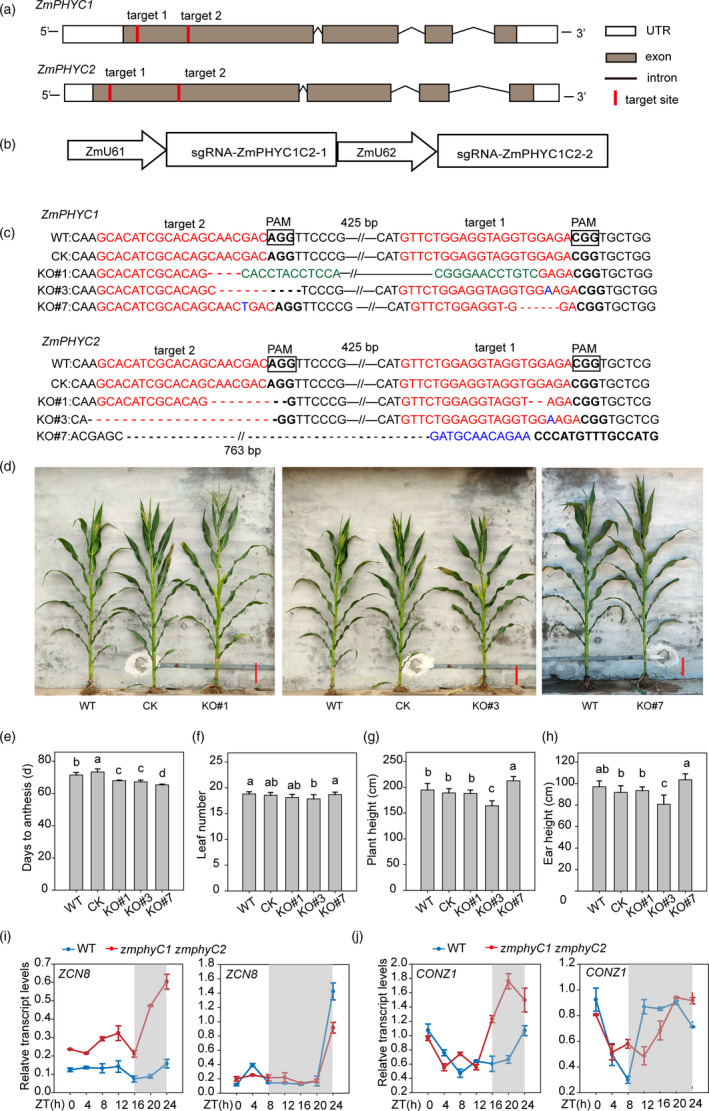
Figure 5.

The zmphyC1 zmphyC2 double knockout mutants display a modest early‐flowering phenotype under natural LD conditions. (a) Diagram showing the two target sites on the ZmPHYC1 and ZmPHYC2 genes, respectively. (b) Diagram illustrating the sgRNA expression cassettes targeting ZmPHYC1 and ZmPHYC2 genes via the dual‐sgRNAs CRISPR/Cas9 vector system. (c) Sequence analysis of the target sites in three homozygouszmphyC1 zmphyC2 double knockout lines. The wild type (WT) sequence is shown at the top. The target sites and protospacer‐adjacent motif (PAM) sequences are shown in the antisense strand and highlighted in red and boldface fonts, respectively. Red and black short dashed lines indicate deletions. Inversions and insertions are indicated by green and blue fonts, respectively. The sequence gap length is shown above or under the sequences. (d) Gross morphologies of WT, CK (null segregates with wild‐type ZmPHYC1 and ZmPHYC2 genes) and zmphyC1 zmphyC2 double knockout plants at flowering (anthesis) under natural LD conditions. Bars = 20 cm. (e‐h) Days to anthesis (e), leaf number (f), plant height (g), and ear height (h) in WT, CK and three knockout lines under natural LD conditions. Data represent the mean and SD from at least 10 maize plants. Different letters indicate significant differences (P < 0.05) according to Bonferroni corrected. (i and j) Transcript profiles of ZCN8 (i) and CONZ1 (j) in the WT (blue lines) and double zmphyC1 zmphyC2 mutant (red lines) plants. The data are relative to the control gene Tubulin 5 and represent means ± SD of three biological replicates. Plants were grown under artificial LD and SD conditions. The gray shadows indicate the dark period. ZT, zeitgeber time.
